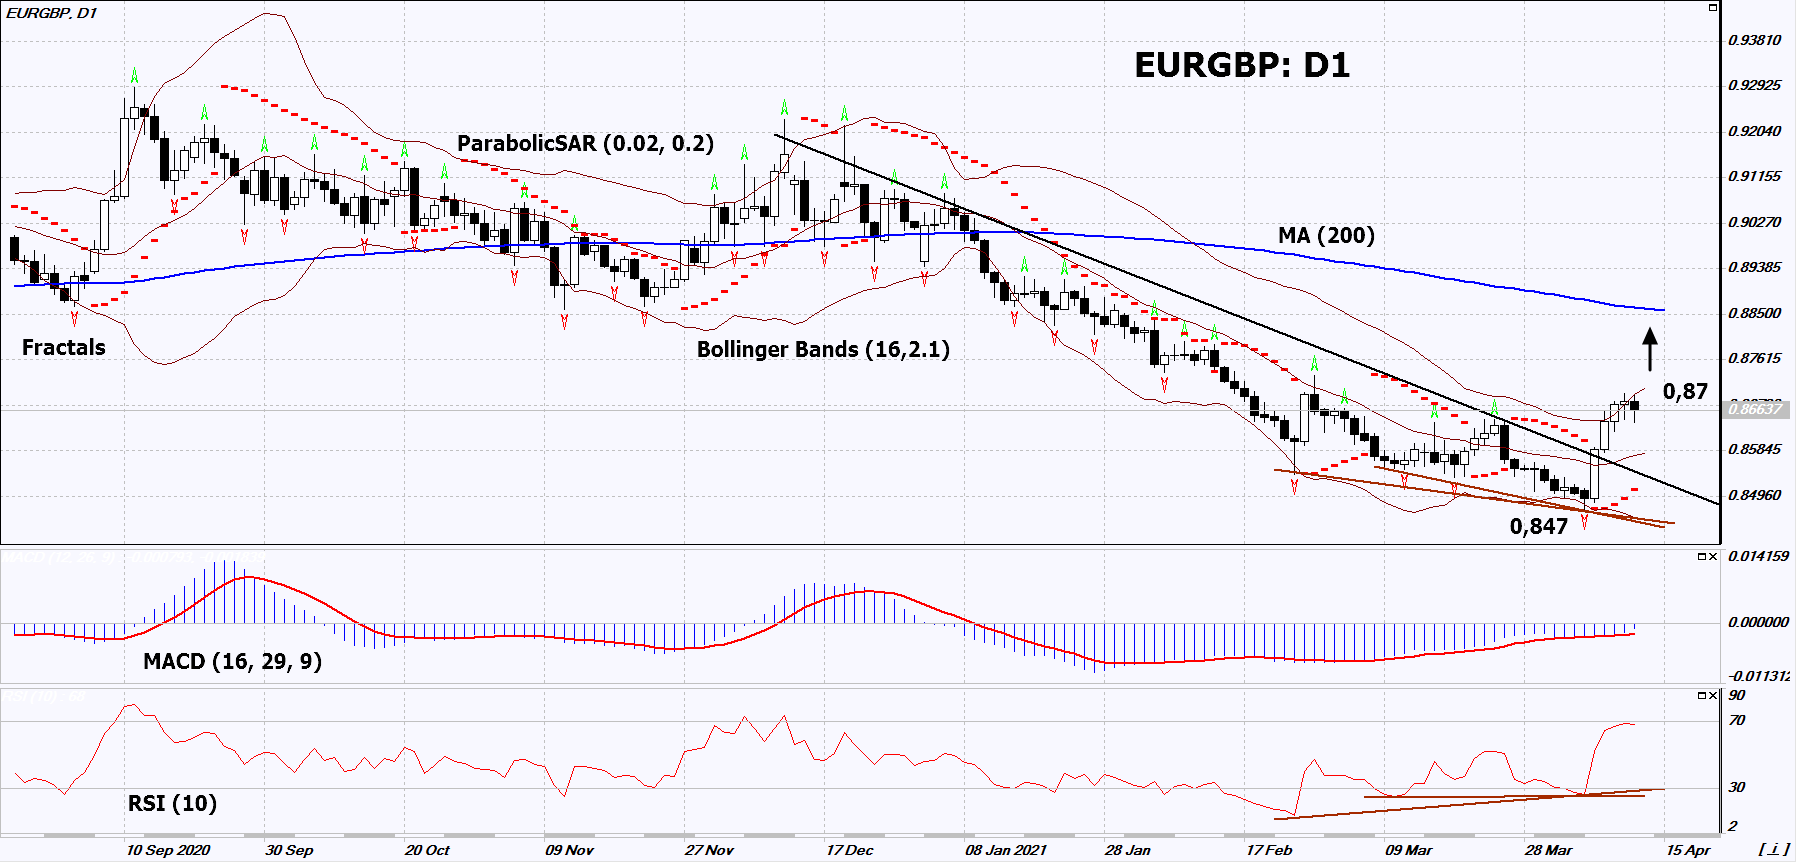
Recommendation for EUR/GBP:Buy
Buy Stop : Above 0,87
Stop Loss : Below 0,847
RSI : Buy
MACD : Buy
MA(200) : Neutral
Fractals : Buy
Parabolic SAR : Buy
Bollinger Bands : Neutral
Chart Analysis
On the daily timeframe, EURGBP: D1 went up from the downtrend. A number of technical analysis indicators formed signals for further growth. We do not rule out a bullish movement if EURGBP rises above the last high: 0.87. This level can be used as an entry point. We can place a stop loss below the Parabolic signal and the last lower fractal: 0.847. After opening a pending order, we can move the stop loss to the next fractal low following the Bollinger and Parabolic signals. Thus, we change the potential profit/loss ratio in our favor. after the transaction, the most risk-averse traders can switch to the four-hour chart and set a stop loss, moving it in the direction of the trend. If the price meets the stop loss (0.847) without activating the order (0.87), it is recommended to delete the order: the market sustains internal changes that have not been taken into account.
Fundamental Analysis
The EU released strong macroeconomic data. On Tuesday, important statistics are expected in Britain. Will the EURGBP quotes grow ? The upward movement means the strengthening of the euro against the British pound. Retail sales in the Eurozone in February rose by 3% in monthly terms and exceeded the forecast (+1.5%). Germany’s trade balance in February grew to a 3-month maximum and amounted to 18.1 billion euros, which is more than expected. The Eurozone trade balance for February will be released on April 16 and is likely to be positive as well. On April 13, several important macroeconomic indicators such as GDP, industrial production, production volume of manufacturing and construction, as well as the trade balance will be published in Britain. Most of the forecasts look negative for the British pound. On April 13, the ZEW Economic Sentiment indicator will be published in the Eurozone and Germany. The outlook is positive for the euro.
