Recommendation for EUR/ZAR: Sell
Sell Stop : Below 20,4
Stop Loss : Above 21,1
| Indicator | Value | Signal |
|---|---|---|
| RSI | Neutral | |
| MACD | Neutral | |
| MA(200) | Neutral | |
| Fractals | Neutral | |
| Parabolic SAR | Sell | |
| Bollinger Bands | Neutral |
Chart Analysis
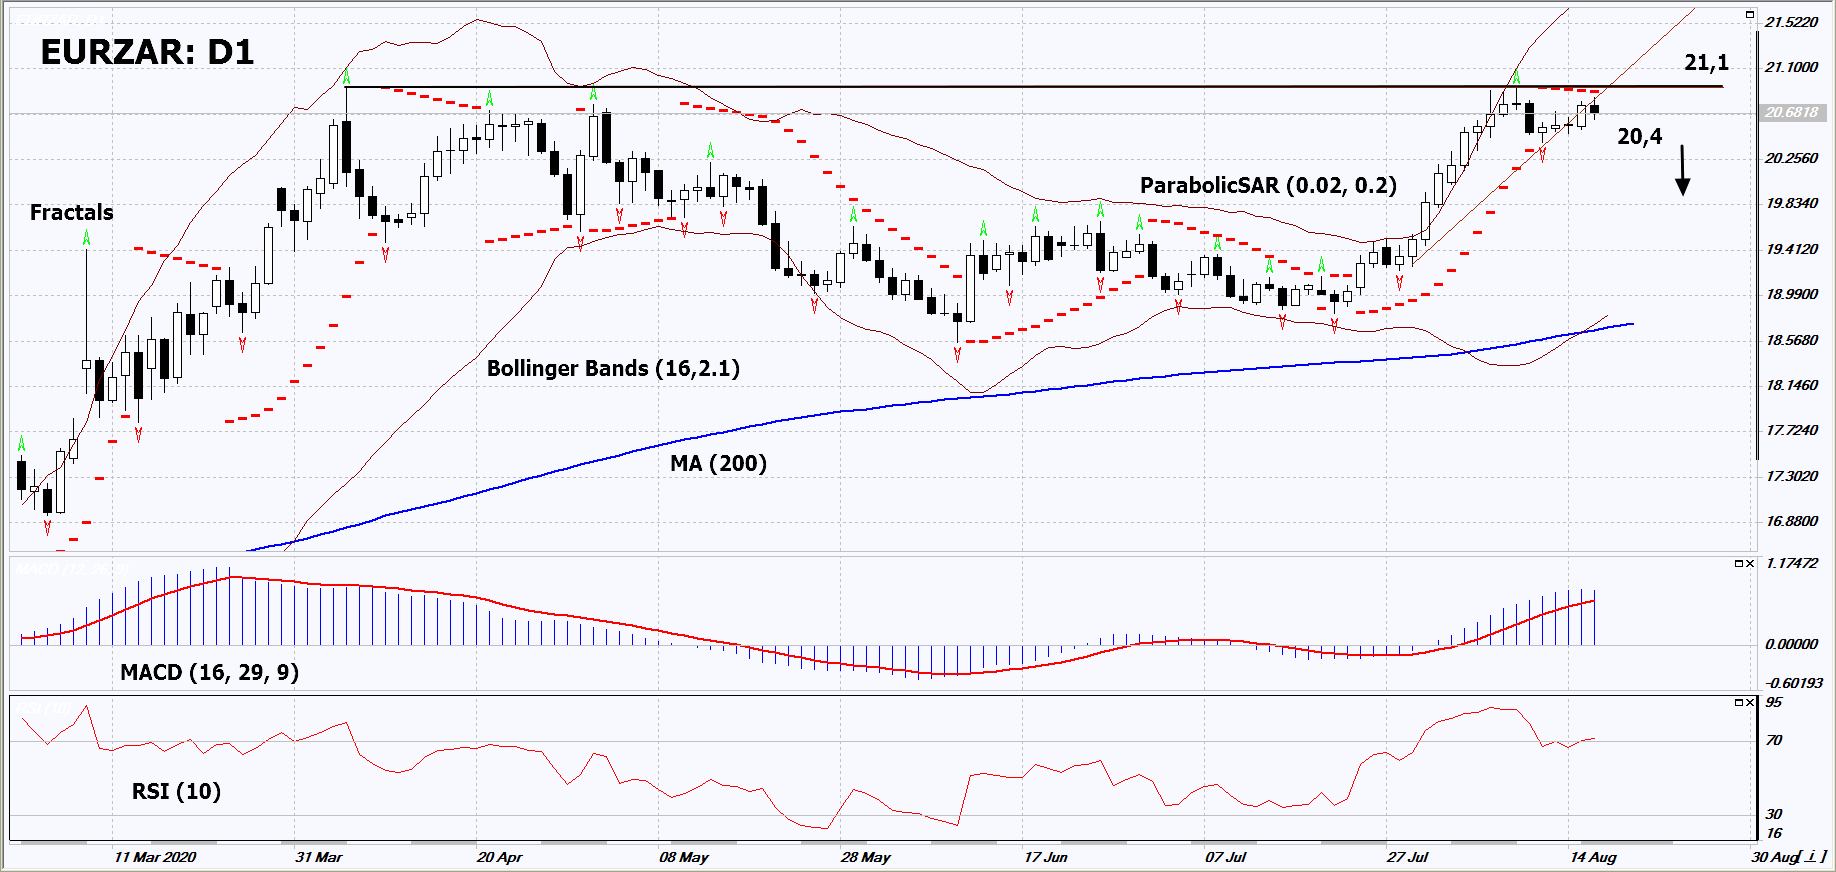
On the daily timeframe, EURZAR: D1 approached the resistance line of the long-term neutral trend. So far it hasn’t been able to overcome it and is trying to correct downward now. A number of technical analysis indicators generated signals for further decline. We do not rule out a bearish move if EURZAR falls below its last low fractal: 20.4. This level can be used as an entry point. The stop loss can be placed above the last upper fractal and Parabolic signal: 21.1. After opening a pending order, the stop loss should be moved following the Bollinger and Parabolic signals to the next fractal low. Thus, we change the potential profit/loss ratio in our favor. After the transaction the most risk-averse traders can switch to the four-hour chart and set a stop loss, moving it in the direction of the bias. If the price meets the stop loss (21.1) without activating the order (20.4), it is recommended to delete the order: some internal changes in the market were not taken into account.
Fundamental Analysis
In this review, we want to consider the dynamics of the Euro against the South African rand. Is the decline in EURZAR quotes possible?