Recommendation for GBP/USD:Sell
Sell Stop : Below 1.3909
Stop Loss : Above 1.3946
RSI : Neutral
MACD : Sell
Donchian Channel : Neutral
MA(200) : Buy
Fractals : Sell
Parabolic SAR : Sell
Chart Analysis
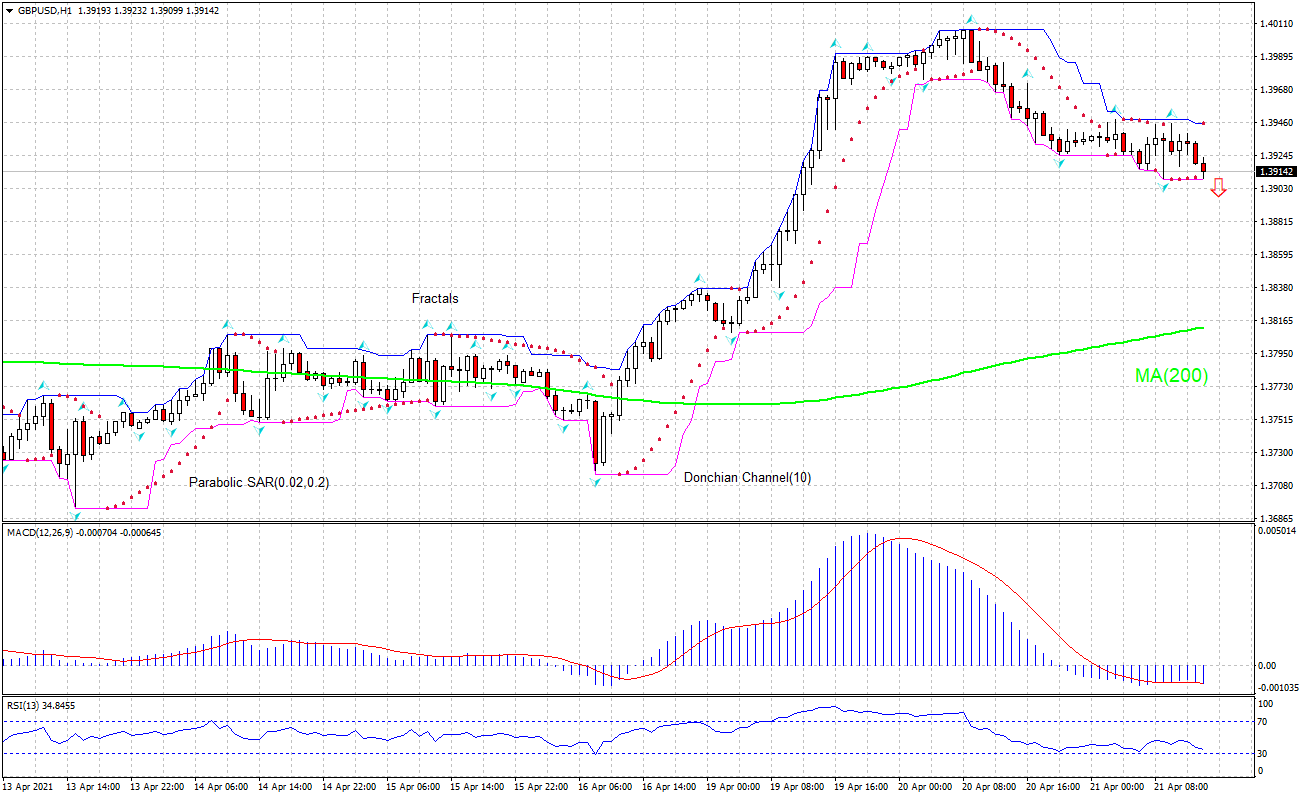
The GBPUSD technical analysis of the price chart on 1-hour timeframe shows GBPUSD: H1 is falling toward the 200-period moving average MA(200) which is rising still. We believe the bearish movement will continue after the price breaches below the lower bound of the Donchian channel at 1.3909. A level below this can be used as an entry point for placing a pending order to sell. The stop loss can be placed above 1.3946. After placing the order, the stop loss is to be moved to the next fractal high indicator, following Parabolic signals. Thus, we are changing the expected profit/loss ratio to the breakeven point. If the price meets the stop loss level without reaching the order, we recommend cancelling the order: the market has undergone internal changes which were not taken into account.
Fundamental Analysis
UK’s inflation rose less than expected in March. Will the GBPUSD retreat persist? UK’s inflation rose less than expected in March: the Office for National Statistics reported UK consumer price index rose 0.7% over year in March after 0.4% gain in February, when an 0.8% increase was forecast. This is bearish for GBPUSD.