| Indicator | Value | Signal |
|---|---|---|
| RSI | Buy | |
| MACD | Buy | |
| MA(200) | Neutral | |
| Fractals | Neutral | |
| Parabolic SAR | Buy | |
| Bollinger Bands | Neutral |
Chart Analysis
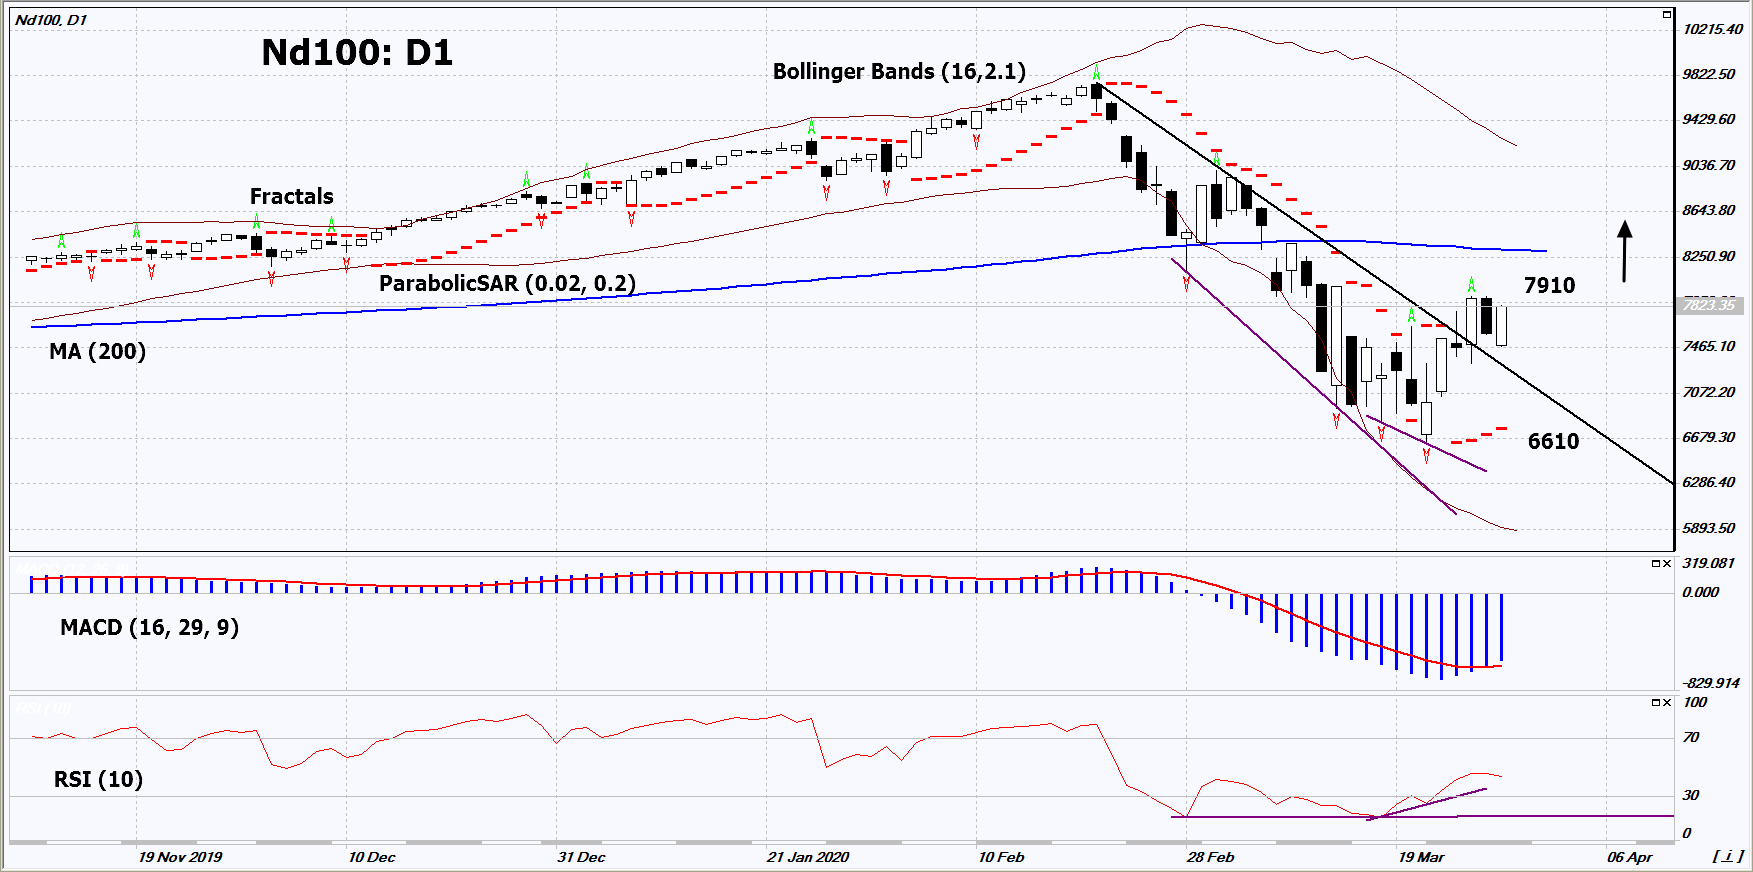
On the daily timeframe, Nd100: D1 broke through the resistance line of the medium-term downtrend. A number of technical analysis indicators formed signals for a further increase. We do not exclude bullish movement if Nd100 rises above its last upper fractal: 7910. This level can be used as an entry point. The initial stop loss is possible below the Parabolic signal, the last lower fractal and the minimum since January 2019: 6610. After opening a pending order, we move the stop loss following the Bollinger and Parabolic signals to the next fractal minimum. Thus, we change the potential profit / loss ratio in our favor. After the transaction, more risk-averse traders can switch to a four-hour chart and set a stop loss, moving it in the direction of trend. If the price overcomes the stop level (6610) without activating the order (7910), it is recommended to delete the order: market sustains internal changes not taken into account.
Fundamental Analysis
The U.S. government allotted $ 2 trillion to help the US economy hit by the Covid-19 epidemic. Will Nd100 quotes grow?