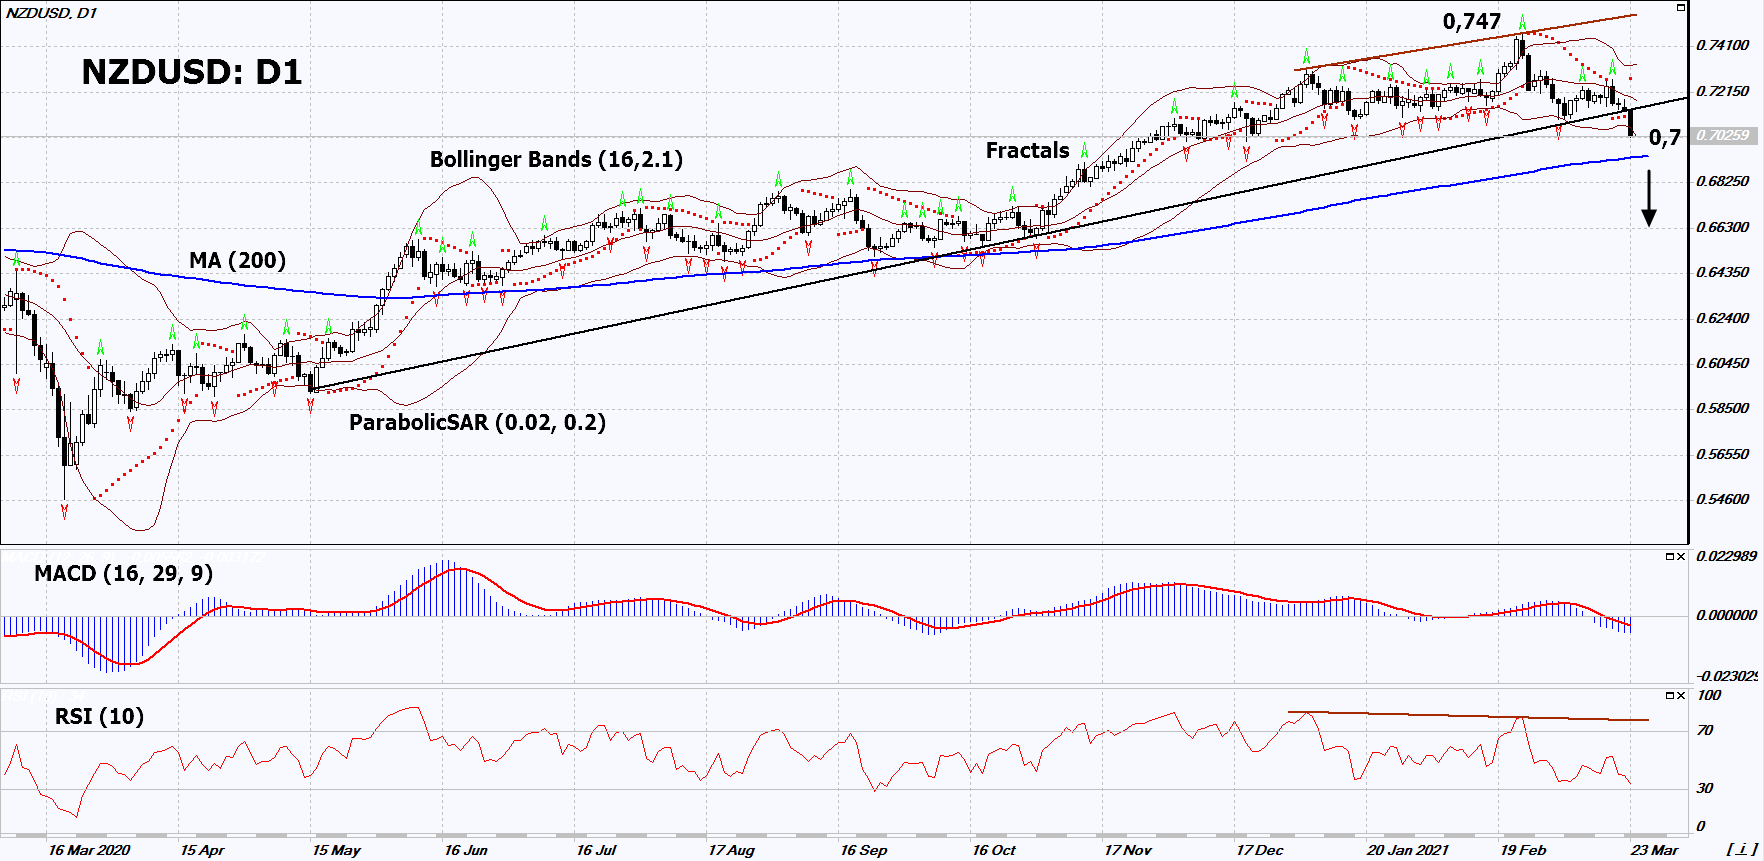
Recommendation for NZD/USD:Sell
Sell Stop : Below 0,7
Stop Loss : Above 0,747
RSI : Sell
MACD : Sell
MA(200) : Neutral
Fractals : Sell
Parabolic SAR : Sell
Bollinger Bands : Neutral
Chart Analysis
On the daily timeframe, NZDUSD: D1 breached down the uptrend support line. A number of technical analysis indicators generated signals for further decline. We do not exclude a bearish movement if NZDUSD: D1 falls below the lower Bollinger band: 0.7. This level can be used as an entry point. We can place a stop loss above the high since July 2017, the upper Bollinger band and the Parabolic signal: 0.747. After opening a pending order, we can move the stop loss to the next fractal maximum following the Bollinger and Parabolic signals. Thus, we change the potential profit/loss ratio in our favor. After the transaction, the most risk-averse traders can switch to the four-hour chart and set a stop loss, moving it in the direction of the bias. If the price meets the stop loss (0.747) without activating the order (0.7), it is recommended to delete the order: the market sustains some internal changes that have not been taken into account.
Fundamental Analysis
The New Zealand government canceled tax breaks for real estate investors. Will the NZDUSD quotes continue to decline? The purpose of the change in tax legislation is to reduce the cost of housing in New Zealand at the expense of rentiers. The government decided to do this by reducing the ROI in real estate, allocated for the subsequent rental of housing. Тhe decision of Australia and New Zealand to support Western sanctions against China based on the situation in the Xinjiang Uygur Autonomous Region of the PRC may have a negative impact on the New Zealand dollar: China is a major buyer of New Zealand goods. We can also note weak economic data: spending on e-cards in December and January fell more than expected. New Zealand’s trade balance for February will be released Wednesday morning, which may affect the dynamics of the New Zealand dollar.
