Recommendation for NZD/USD:Sell
Sell Stop։ Below 0.7096
Stop Loss։ Above 0.7142
| Indicator | Signal |
|---|---|
| RSI | Neutral |
| MACD | Sell |
| Donchian Channel | Sell |
| MA(200) | Buy |
| Fractals | Buy |
| Parabolic SAR | Sell |
Chart Analysis
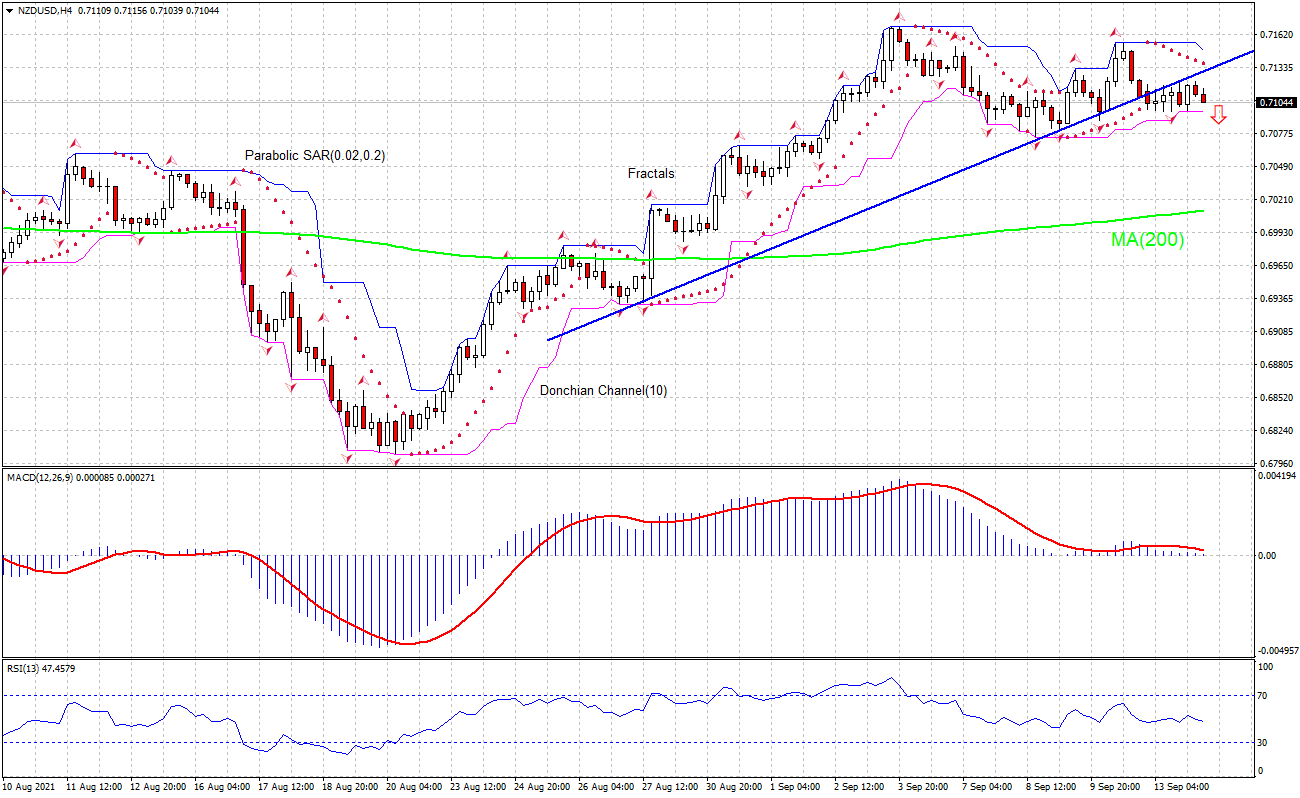
The technical analysis of the NZDUSD price chart on 4-hour timeframe shows NZDUSD,H4 is falling under the support line above the 200-period moving average MA(200) which is rising still. We believe the bearish momentum will continue after the price breaches below the lower bound of the Donchian channel at 0.7096. A level below this can be used as an entry point for placing a pending order to sell. The stop loss can be placed above 0.7142. After placing the order, the stop loss is to be moved to the next fractal high, following Parabolic signals. Thus, we are changing the expected profit/loss ratio to the breakeven point. If the price meets the stop loss level without reaching the order, we recommend cancelling the order: the market has undergone internal changes which were not taken into account.
Fundamental Analysis
New Zealand retail card spending fell in August. Will the NZDUSD price continue rebounding?
New Zealand electronic retail card spending fell in August as the country went into lockdown in the second half of the month. The Statistics New Zealand reported card spending tumbled 11.4% over year in August after 4.7% growth in July. At the same time food inflation slowed: food prices in New Zealand increased 2.4% year-over-year in August, slowing from 2.8% in each of the previous two months. Falling consumer retail spending and slowing food inflation are bearish for NZDUSD.