Recommendation for S&P 500 Index: Buy
Buy Stop : Above 3240.85
Stop Loss : Below 3105.79
| Indicator | Value | Signal |
|---|---|---|
| RSI | Neutral | |
| MACD | Buy | |
| Donchian Channel | Buy | |
| MA(200) | Buy | |
| Fractals | Buy | |
| Parabolic SAR | Buy |
Chart Analysis
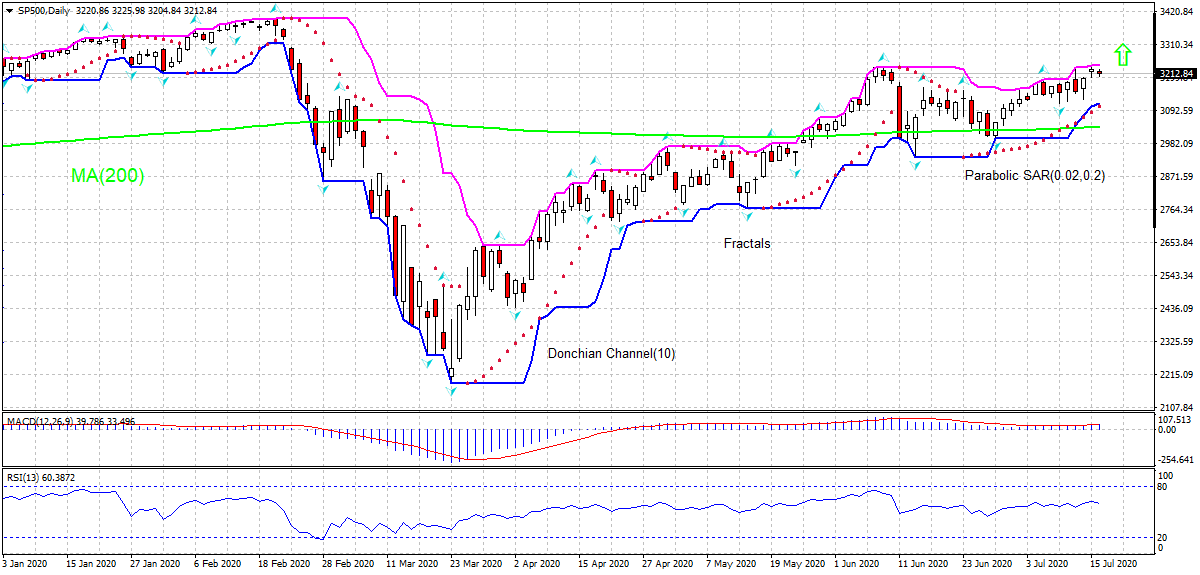
On the daily timeframe SP500: D1 has risen above the 200-day moving average MA(200), which is rising itself. We believe the bullish momentum will continue after the price breaches above the upper boundary of Donchian channel at 3240.85. A level above this can be used as an entry point for placing a pending order to buy. The stop loss can be placed below 3105.79. After placing the order, the stop loss is to be moved every day to the next fractal low, following Parabolic signals. Thus, we are changing the expected profit/loss ratio to the breakeven point. If the price meets the stop loss level (3105.79) without reaching the order (3240.85), we recommend cancelling the order: the market has undergone internal changes which were not taken into account.
Fundamental Analysis
Economic data from US were positive recently. Will the SP500 rebound continue?