Recommendation for USD/CAD: Sell
Sell Stop : Below 1,341
Stop Loss : Above 1,371
| Indicator | Value | Signal |
|---|---|---|
| RSI | Neutral | |
| MACD | Neutral | |
| MA(200) | Neutral | |
| Fractals | Sell | |
| Parabolic SAR | Sell | |
| Bollinger Bands | Sell |
Chart Analysis
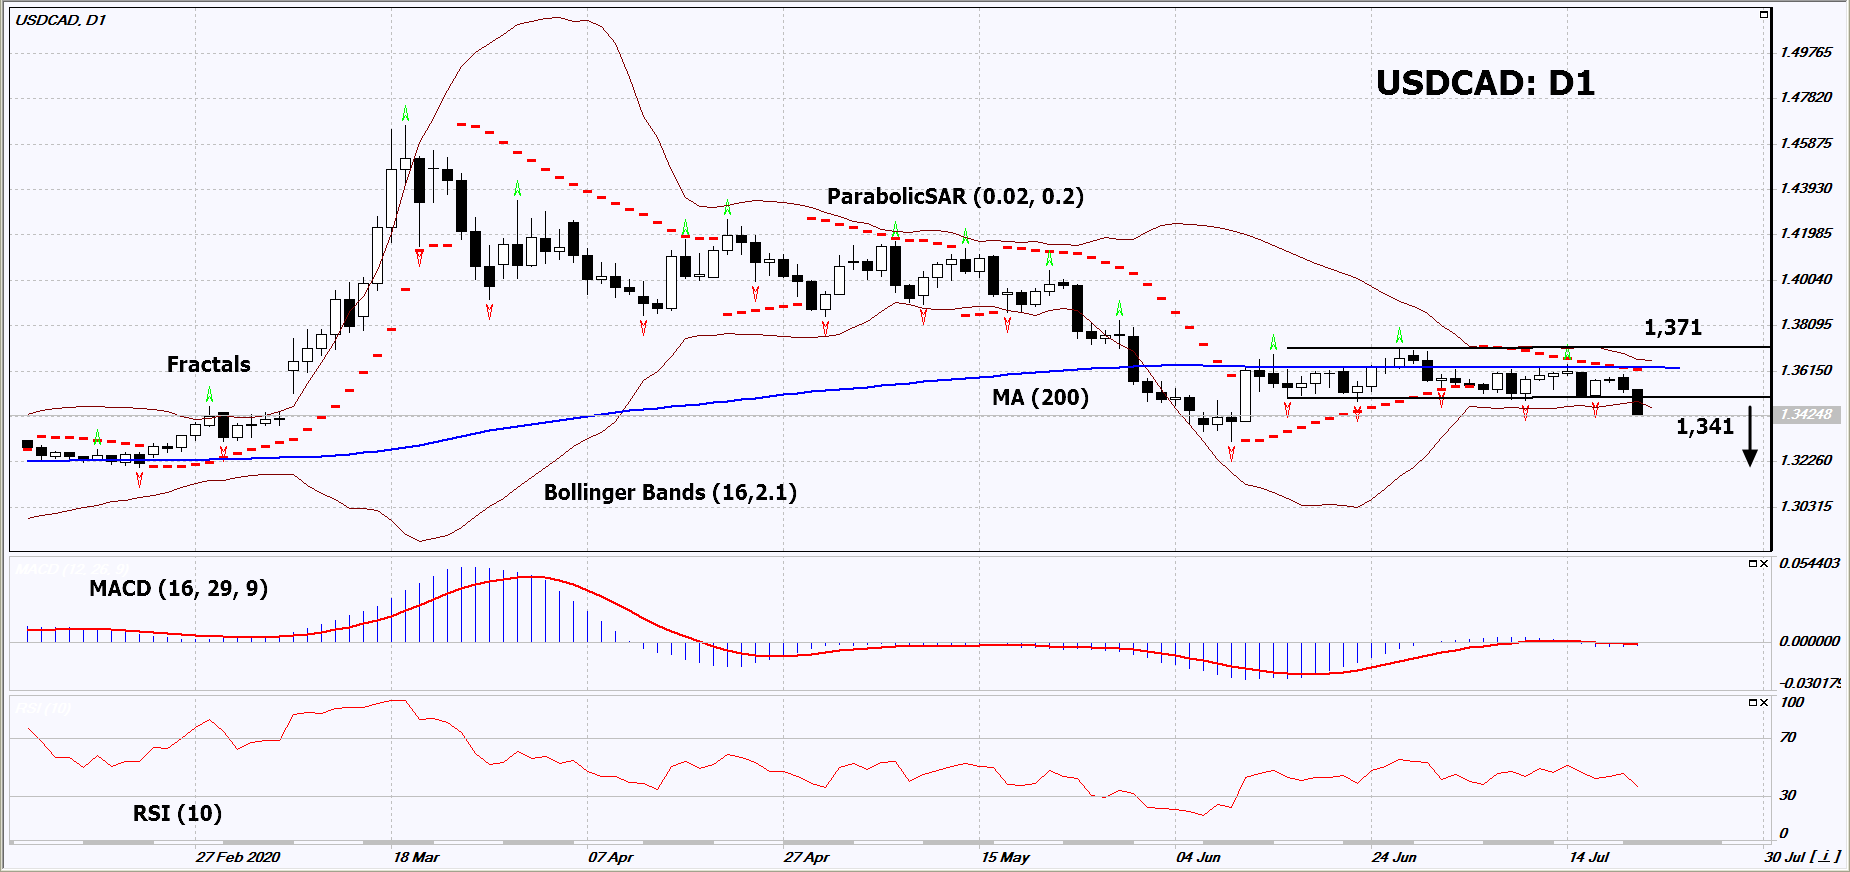
On the daily timeframe, USDCAD: D1 broke down the neutral trend support line. A number of technical analysis indicators formed signals for a further decline. We do not rule out a bearish movevent if USDCAD falls below its latest minimum: 1.341. This level can be used as an entry point. The stop loss can be plased above the last two upper fractals, the upper Bollinger band, 200-day moving average and the Parabolic signal: 1.371. After opening a pending order, we move the stop loss to the next fractal low following the Bollinger and Parabolic signals. Thus, we change the potential profit/loss ratio in our favor. After the transaction, the most risk-averse traders can switch to a four-hour chart and set a stop-loss, moving it in the direction of the trend. If the price meets the stop loss level (1.371) without activating the order (1.341), it is recommended to delete the order: some internal changes in the market were not taken into account.
Fundamental Analysis
Canadian retail sales rose in May. Will the Canadian dollar continue to strengthen?