Recommendation for USD/CHF: Buy
Buy Stop : Above 0,919
Stop Loss : Below 0,897
| Indicator | Value | Signal |
|---|---|---|
| RSI | Buy | |
| MACD | Buy | |
| MA(200) | Neutral | |
| Fractals | Neutral | |
| Parabolic SAR | Sell | |
| Bollinger Bands | Buy |
Chart Analysis
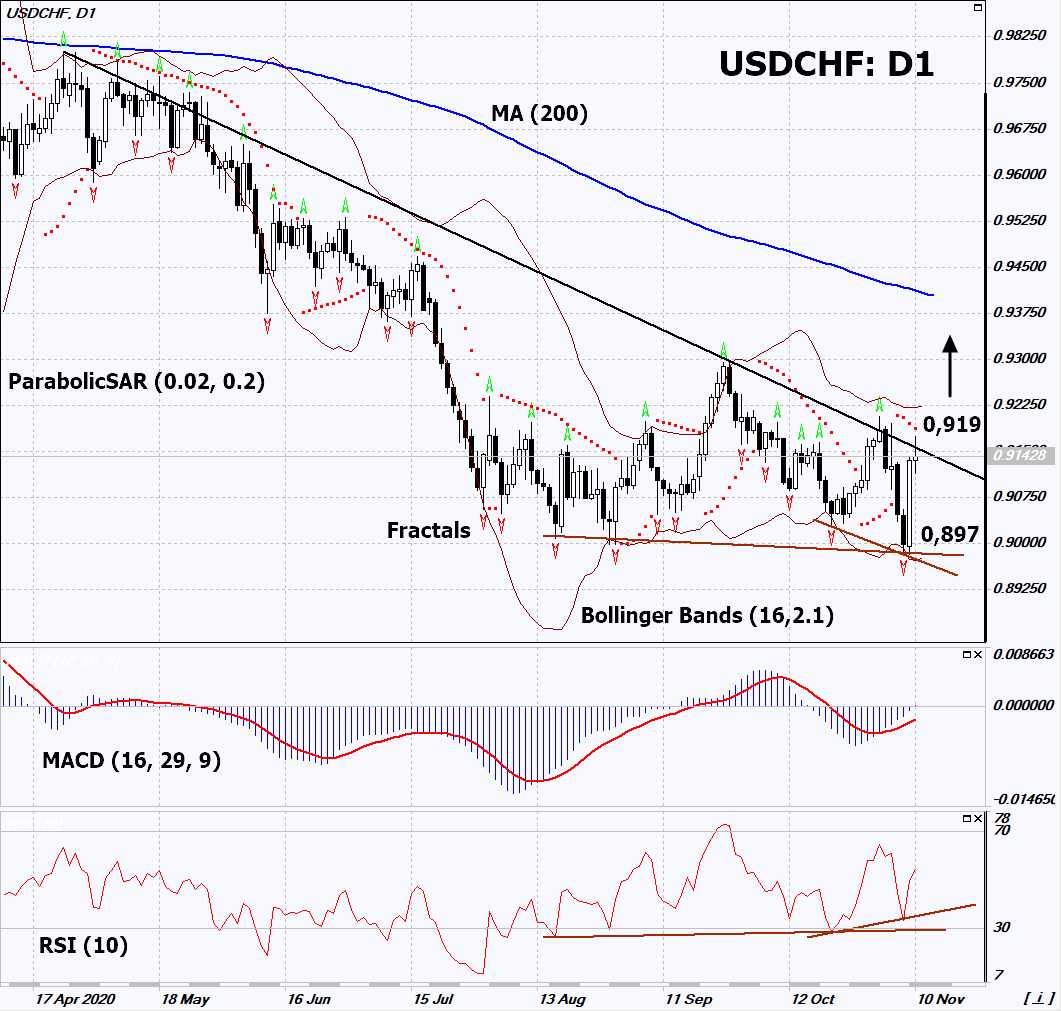
On the daily timeframe, USDCHF: D1 approached the downtrend resistance line. It must be broken upward before opening a position. A number of technical analysis indicators formed signals for further growth. We do not rule out a bullish move if USDCHF rises above the Parabolic signal and its latest maximum: 0.919. This level can be used as an entry point. We can place a stop loss below the lower Bollinger line and the last lower fractal: 0.897. After opening a pending order, we can move the stop loss to the next fractal low following the Bollinger and Parabolic signals. Thus, we change the potential profit/loss ratio in our favor. After the transaction, the most risk-averse traders can switch to the 4-hour chart and set a stop loss, moving it in the direction of the bias. If the price meets the stop loss (0.897) without activating the order (0.919), it is recommended to delete the order: the market sustains internal changes that have not been taken into account.
Fundamental Analysis
Investors fear the Swiss National Bank’s currency intervention in case of an excessive strengthening of the Swiss franc. Will the USDCHFquotes continue to grow?