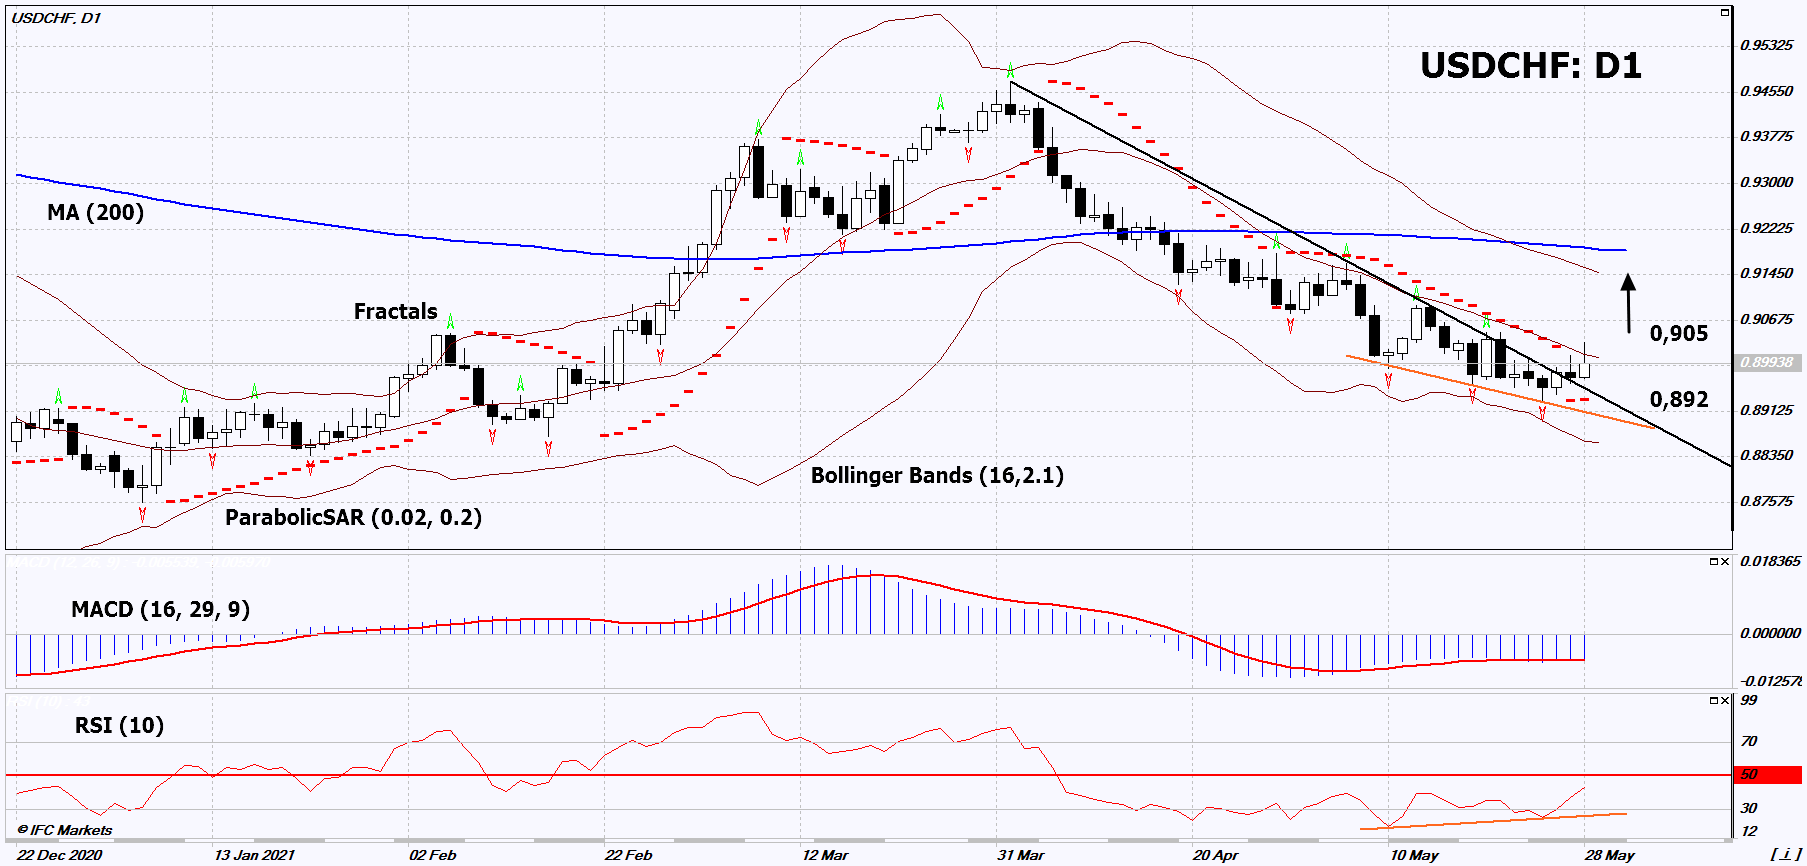
Recommendation for USD/CHF:Buy
Buy Stop : Above 0,905
Stop Loss : Below 0,892
RSI : Buy
MACD : Neutral
MA(200) : Neutral
Fractals : Neutral
Parabolic SAR : Buy
Bollinger Bands : Neutral
Chart Analysis
On the daily timeframe, USDCHF: D1 went up from the downtrend. A number of technical analysis indicators have formed signals for further growth. We do not rule out a bullish movement if USDCHF: D1 rises above the last high fractal: 0.905. This level can be used as an entry point. The initial risk limitation is possible below the Parabolic signal and the last lower fractal: 0.892. After opening a pending order, the stop loss is to be moved following the Bollinger and Parabolic signals to the next fractal low. Thus, we are changing the potential profit / loss ratio in our favor. After the transaction, the most cautious traders can switch to the four-hour chart and set a stop loss, moving it in the direction of the bias. If the price overcomes the stop loss (0.892) without activating the order (0.905), it is recommended to delete the order: there are internal changes in the market that were not taken into account.
Fundamental Analysis
On June 1, 2021, Switzerland is expected to publish negative macroeconomic data. Will the weakening of Swiss franc continue? On the USDCHF chart, this trend looks like an increase. The Swiss GDP for the Q1 of 2021 will be released on June 1. It is expected to fall by 3.9% in annual terms. This is more than the decline in the Q3 and Q4 of 2020 by 1.6%. The decline in Switzerland’s GDP in the Q2 of 2020 was a record amid the COVID-19 epidemic and amounted to 9.3%. Earlier in Switzerland, the employment rate (Non Farm Payrolls) fell for the Q1 of this year. It turned out to be worse than forecasted, as well as the trade balance for April. As a reminder, the US markets are closed on May 31 due to the Memorial Day holiday.
