Recommendation for USD/CZK: Neutral
Buy Stop : Above 23,45
Stop Loss : Below 22,4
| Indicator | Value | Signal |
|---|---|---|
| RSI | Neutral | |
| MACD | Sell | |
| MA(200) | Neutral | |
| Fractals | Neutral | |
| Parabolic SAR | Buy | |
| Bollinger Bands | Neutral |
Chart Analysis
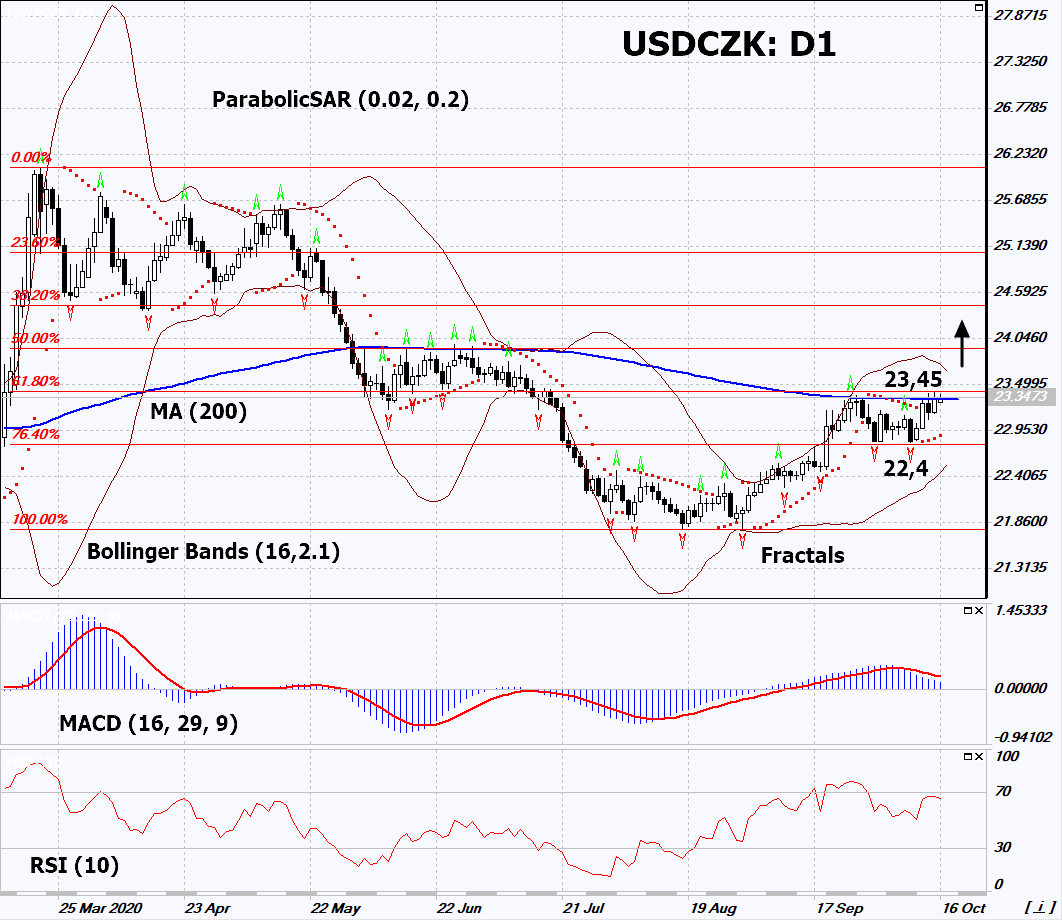
On the daily timeframe, USDCZK: D1 is in a short-term neutral range and is trying to continue moving up. A number of technical analysis indicators generated signals for further growth. We do not rule out a bullish move if USDCZK rises above its latest high and the 200-day moving average line: 23.45. This level can be used as an entry point. We can set a stop loss below the Parabolic signal, the last 3 lower fractals and the lower Bollinger line: 22.4. After opening a pending order, we move the stop loss to the next fractal low following the Bollinger and Parabolic signals. Thus, we change the potential profit/loss ratio in our favor. After the transaction, the most risk-averse traders can switch to the four-hour chart and set a stop loss, moving it in the direction of the trend. If the price meets the stop loss (22.4) without activating the order (23.45), we recommend to delete the order: the market sustains internal changes that have not been taken into account.
Fundamental Analysis
The number of patients with coronavirus increased dramatically in the Czech Republic. The country’s government introduced strict quarantine until early November. Will the USDCZK quotes grow ?