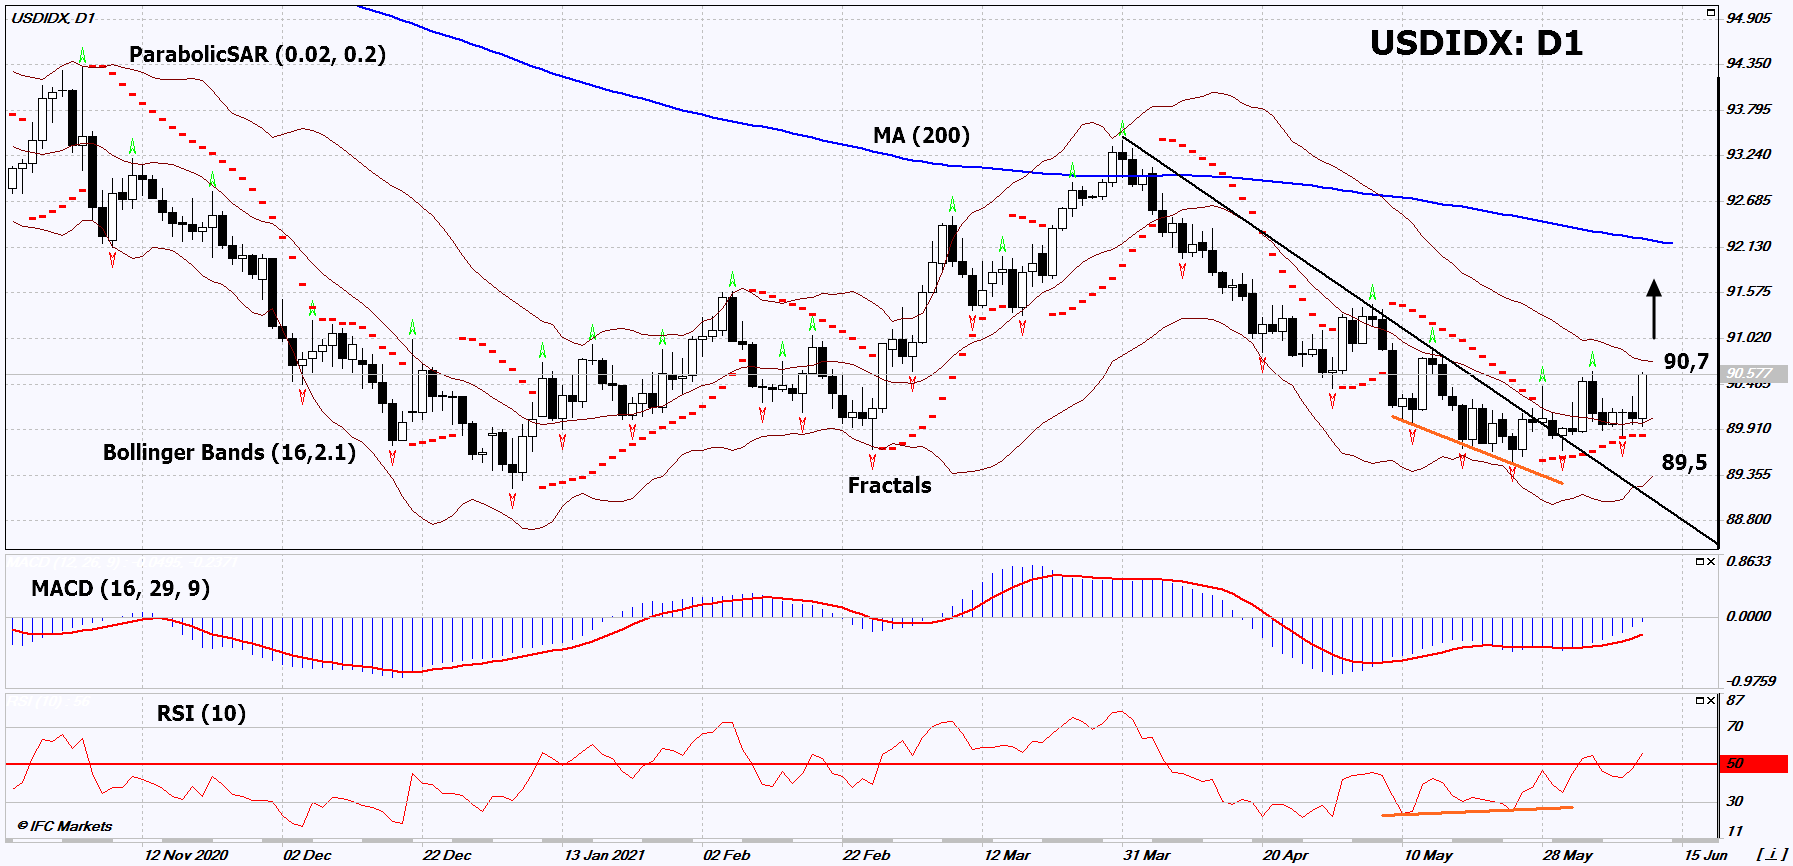
Recommendation for US Dollar Index:Buy
Buy Stop : Above 90,7
Stop Loss : Below 89,5
RSI : Buy
MACD : Buy
MA(200) : Neutral
Fractals : Neutral
Parabolic SAR : Buy
Bollinger Bands : Neutral
Chart Analysis
On the daily timeframe, USDIDX: D1 went up from the downtrend. A number of technical analysis indicators have generated signals for further growth. We are not ruling out a bullish movement if USDIDX rises above the last upper fractal and upper Bollinger band: 90.7. This level can be used as an entry point. The initial risk limitation is possible below the Parabolic signal and 3 lower fractals: 89.5. After opening a pending order, move the stop to the next fractal low following the Bollinger and Parabolic signals. Thus, we change the potential profit / loss ratio in our favor. The most cautious traders, after making a deal, can go to the four-hour chart and set a stop-loss, moving it in the direction of movement. If the price overcomes the stop level (89.5) without activating the order (90.7), it is recommended to delete the order: there are internal changes in the market that were not taken into account.
Fundamental Analysis
Investors are not ruling out that the Fed will announce plans to cut the bond buyback program at its next meeting on June 16. Will USDIDX quotations grow? Inflation in the US in May was 5%, which is the highest since August 2008. It far exceeded the Fed’s target of 2%. Investors do not exclude that the American regulator will have to reassure market participants and, at least, announce plans to tighten monetary policy. A rate hike (+ 0.25%) is not expected. The Fed may announce a reduction in its bond buyback program (quantitative easing). Moreover, the beginning of such a reduction may occur at the end of summer. Recall that the Fed is currently issuing money and buying back bonds in the amount of $ 120 billion per month.
