Recommendation for USD/JPY: Buy
Buy Stop : Above 106,6
Stop Loss : Below 103,9
| Indicator | Value | Signal |
|---|---|---|
| RSI | Buy | |
| MACD | Sell | |
| MA(200) | Neutral | |
| Fractals | Neutral | |
| Parabolic SAR | Buy | |
| Bollinger Bands | Neutral |
Chart Analysis
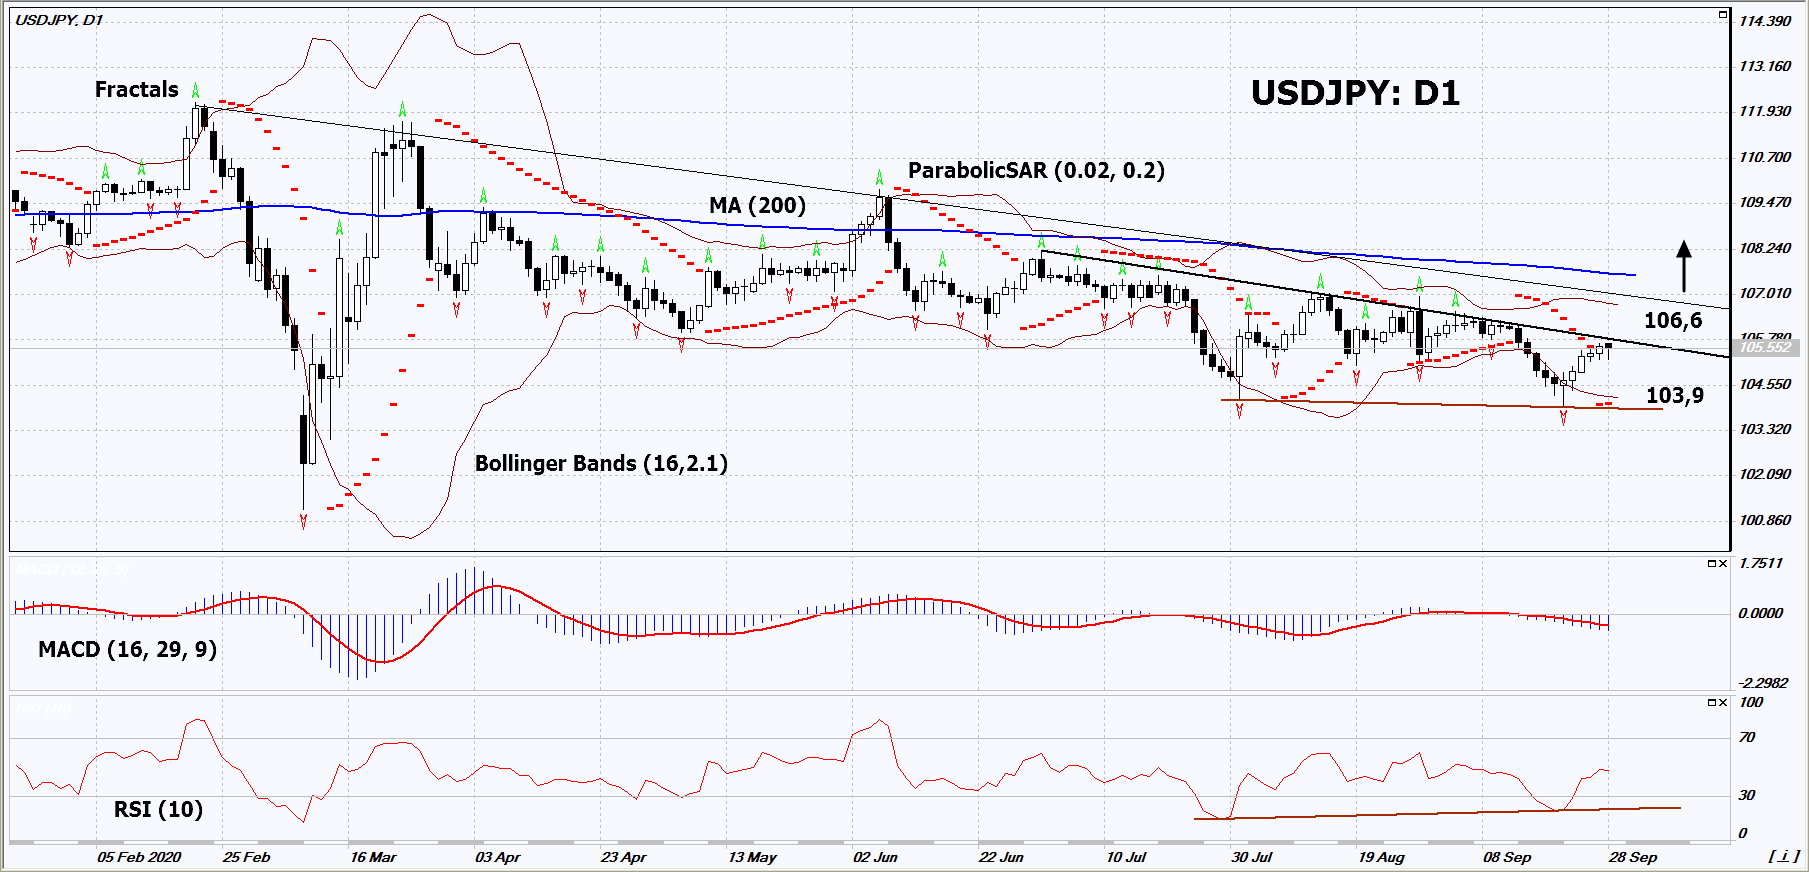
On the daily timeframe, USDJPY: D1 approached the downtrend resistance line. It must be broken upward before opening a position. A number of technical analysis indicators formed signals for further growth. We do not exclude a bullish movement if USDJPY rises above the last upper fractal and upper Bollinger band: 106.6. This level can be used as an entry point. We can place a stop loss below the Parabolic signal, the lower Bollinger line and the last lower fractal: 103.9. After opening a pending order, we move the stop loss following the Bollinger and Parabolic signals to the next fractal low. Thus, we change the potential profit/loss ratio in our favor. After the transaction, the most risk-averse traders can switch to the four-hour chart and set a stop loss, moving it in the direction of the trend. If the price meets the stop loss (103.9) without activating the order (106.6), it is recommended to delete the order: some internal changes in the market have not been taken into account.
Fundamental Analysis
This week Japan is to publish significant macroeconomic data. Will USDJPY quotes grow?