Recommendation for XAU AUD: Buy
Buy Stop : Above 2700
Stop Loss : Below 2600
| Indicator | Value | Signal |
|---|---|---|
| RSI | Buy | |
| MACD | Neutral | |
| MA(200) | Neutral | |
| Fractals | Buy | |
| Parabolic SAR | Buy | |
| Bollinger Bands | Buy |
Chart Analysis
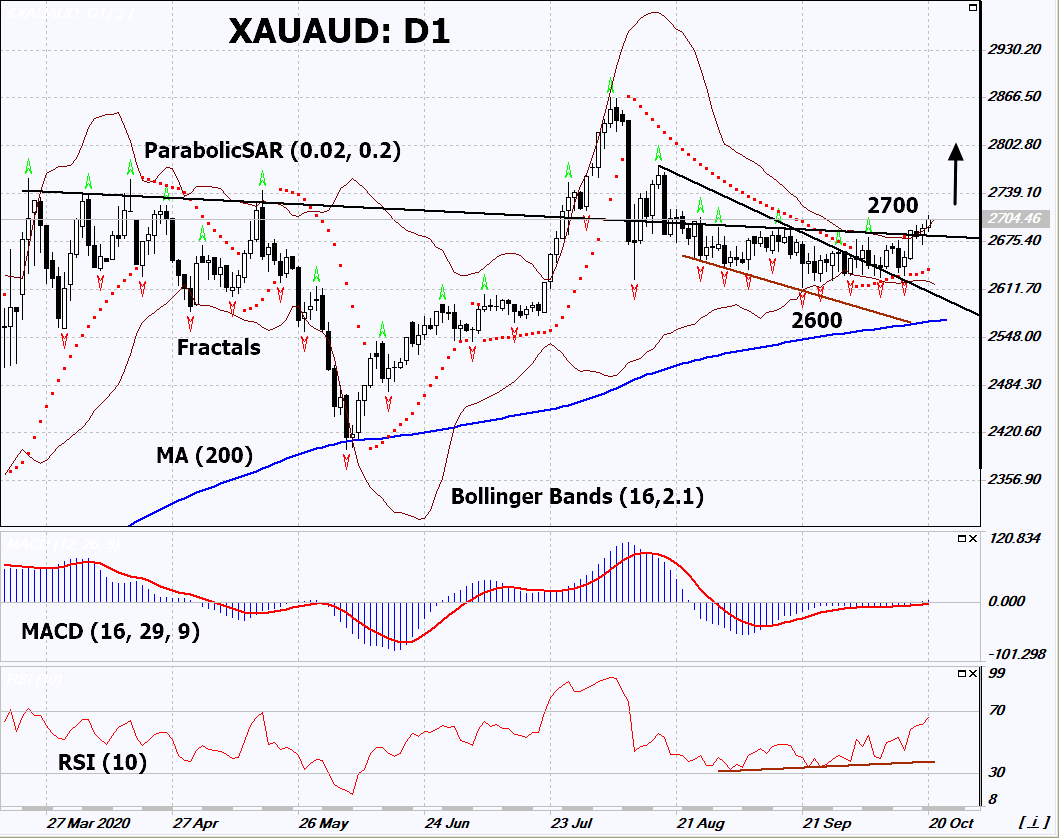
On the daily timeframe, XAUAUD: D1 exceeded the downtrend resistance line. A number of technical analysis indicators formed signals for further growth. We do not rule out a bullish move if XAUAUD rises above its last maximum: 2700-2710. This level can be used as an entry point. We can place a stop loss below the Parabolic signal and the lower Bollinger line: 2600. After opening a pending order, we can move the stop loss following the Bollinger and Parabolic signals to the next fractal low. Thus, we change the potential profit/loss ratio in our favor. After the transaction, the most risk-averse traders can switch the 4-hour chart and place a stop loss, moving it in the direction of the bias. If the price meets the stop loss (2600) without activating the order (2700), it is recommended to delete the order: some internal changes in the market have were not been taken into account.
Fundamental Analysis
In this review, we propose to consider the XAUAUD Personal Composite Instrument (PCI). It reflects the price action of Gold vs the Australian dollar. Is the growth of XAUAUD quotes possible?