Recommendation for XAU AUD: Sell
Sell Stop: Below 2540
Stop Loss : Above 2700
| Indicator | Value | Signal |
|---|---|---|
| RSI | Neutral | |
| MACD | Sell | |
| MA(200) | Neutral | |
| Fractals | Neutral | |
| Parabolic SAR | Sell | |
| Bollinger Bands | Sell |
Chart Analysis
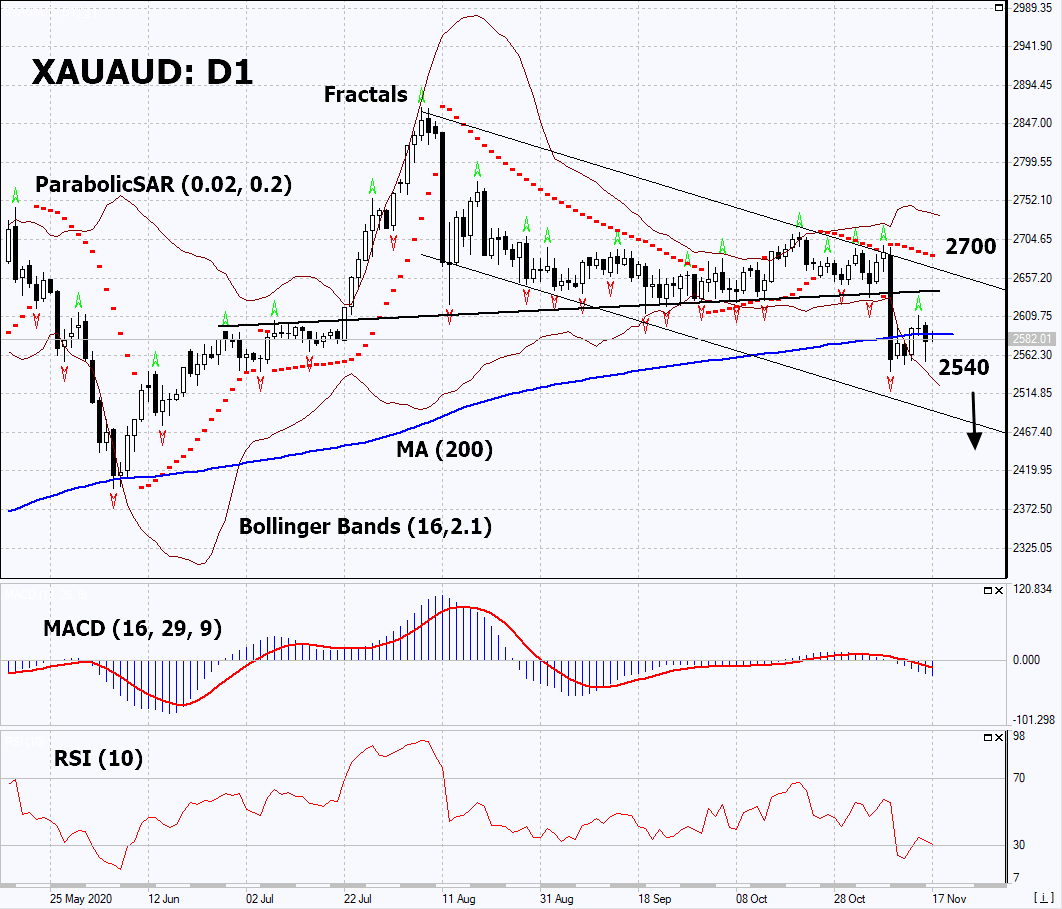
On the daily timeframe, XAUAUD: D1 is correcting down from the historical high. It broke down the downtrend support line and is below the 200-day moving average at the moment. A number of technical analysis indicators formed signals for further decline. We do not rule out a bearish movement if XAUAUD falls below the last lower fractal: 2540. This level can be used as an entry point. We can place a stop loss above the last upper fractal and Parabolic signal: 2700. After opening a pending order, we can move the stop loss following the Bollinger and Parabolic signals to the next fractal maximum. Thus, we change the potential profit/loss ratio in our favor. After the transaction, the most risk-averse traders can switch to the 4-hour chart and set a stop loss, moving it in the direction of the bias. If the price meets the stop loss (2700) without activating the order (2540), it is recommended to delete the order: the market is undergoing internal changes not taken into account.
Fundamental Analysis
In this review, we propose to consider the XAUAUD Personal Composite Instrument (PCI). It reflects the price action of gold against the Australian dollar. Will the XAUAUD continue to decline?