Recommendation for Gold: Buy
Buy Stop : Above 1935
Stop Loss : Below 1845
| Indicator | Value | Signal |
|---|---|---|
| RSI | Neutral | |
| MACD | Buy | |
| MA(200) | Neutral | |
| Fractals | Neutral | |
| Parabolic SAR | Buy | |
| Bollinger Bands | Neutral |
Chart Analysis
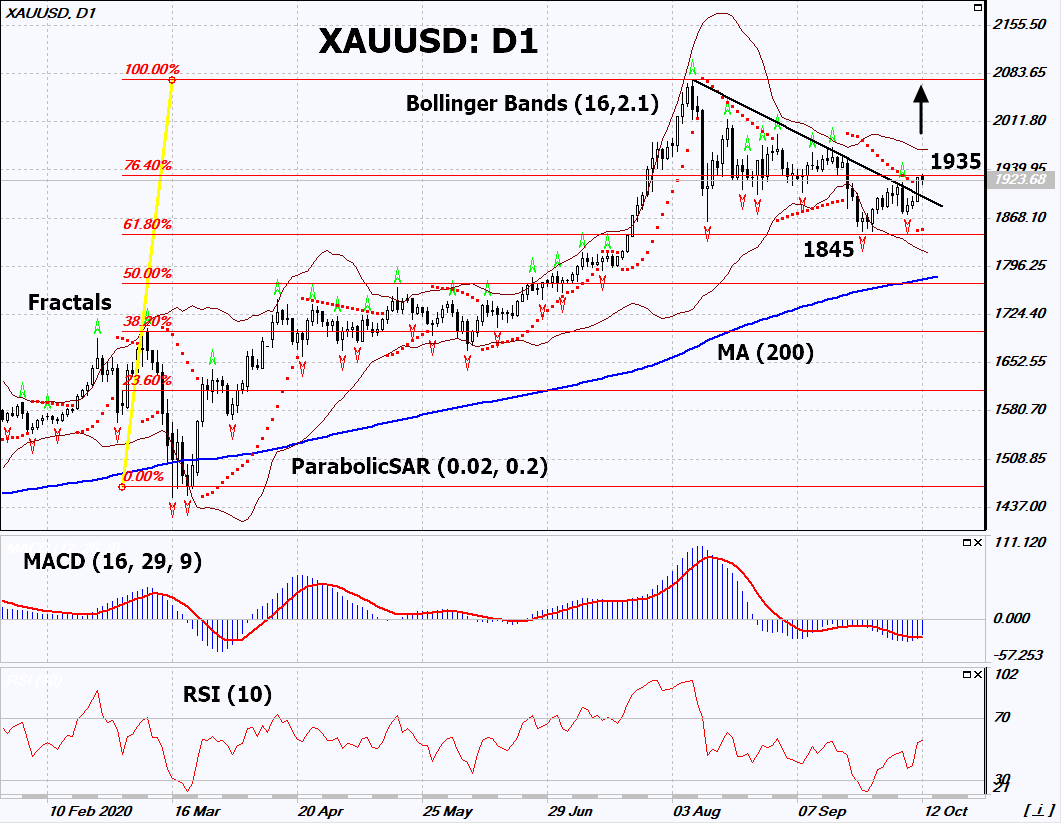
On the daily timeframe, XAUUSD: D1 breached up the downtrend resistance line. A number of technical analysis indicators have formed signals for further growth. We do not rule out a bullish move if XAUUSD rises above its last high: 1935. This level can be used as an entry point. We can place a stop loss below the Parabolic signal and 2 last lower fractals: 1845. After opening a pending order, we move the stop loss following the Bollinger and Parabolic signals to the next fractal minimum. Thus, we change the potential profit/loss ratio in our favor. After the transaction, the most risk-averse traders can switch to the four-hour chart and set a stop loss, moving it in the direction of the bias. If the price meets the stop loss (1845) without activating the order (1935), it is recommended to delete the order: the market sustained internal changes that were not taken into account.
Fundamental Analysis
The weakening US dollar is driving up precious metals prices. Will the XAUUSD continue to grow?