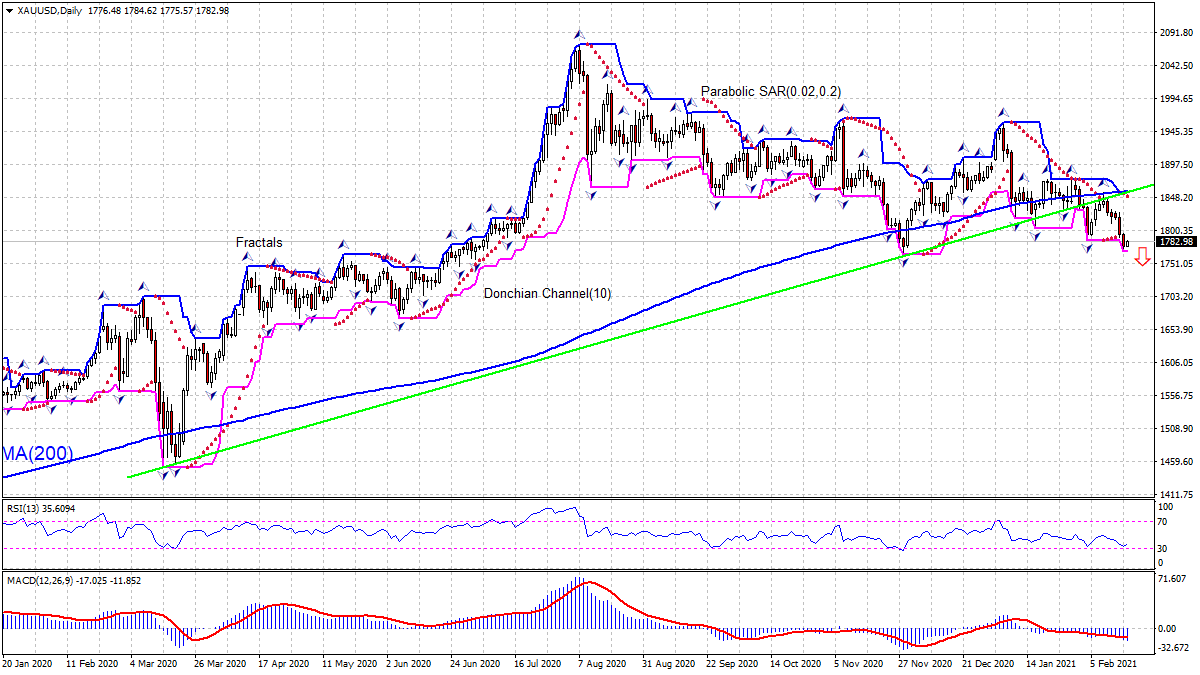
Recommendation for Gold:Sell
Sell Stop : Below 1769.31
Stop Loss : Above 1855
| Indicator | Value | Signal |
|---|---|---|
| RSI | Neutral | |
| MACD | Sell | |
| MA(200) | Sell | |
| Fractals | Sell | |
| Parabolic SAR | Sell |
Chart Analysis
The XAUUSD technical analysis of the price chart in daily timeframe shows the XAUUSD: D1 is retracing lower under the 200-day moving average MA(200), which has leveled off. The price has fallen below the support line. We believe the bearish momentum will continue after the price breaches below the lower boundary of Donchian channel at 1769.31. This level can be used as an entry point for placing a pending order to sell. The stop loss can be placed above the upper Donchian boundary at 1855. After placing the order, the stop loss is to be moved every day to the next fractal high, following Parabolic signals. Thus, we are changing the expected profit/loss ratio to the breakeven point. If the price meets the stop loss level (1769.13) without reaching the order (1855), we recommend cancelling the order: the market has undergone internal changes which were not taken into account.
Fundamental Analysis
Manufacturing data indicate global economy downturn is easing. Will the XAUUSD price retreat continue ? Global economy recovery continues as the rollout and deployment of COVID-19 vaccines speed up globally. Factory activity expansion continued globally in January as evidenced by purchasing managers indexes for Europe, the US and China. Thus, Markit’s Manufacturing Purchasing Managers Index’s (PMI) final reading for the euro zone came in at 54.8 in January after 55.2 in the previous month. The US Institute for Supply Management data showed its manufacturing index came in at 58.7 for January after 60.5 in December. China’s official manufacturing purchasing managers index and the private Caixin manufacturing purchasing managers index both showed factory activity still expanding in January: the Caixin/Markit services Purchasing Managers’ Index (PMI) came in at 51.5 for January after 53 in December. Readings above 50 indicate growth, below 50 indicate contraction. Continued global manufacturing recovery is bearish for gold prices.
