Recommendation for Palladium:Buy
Buy Stop : Above 3017
Stop Loss : Below 2831
RSI : Sell
MACD : Buy
Donchian Channel : Buy
MA(200) : Buy
Fractals : Buy
Parabolic SAR : Buy
Chart Analysis
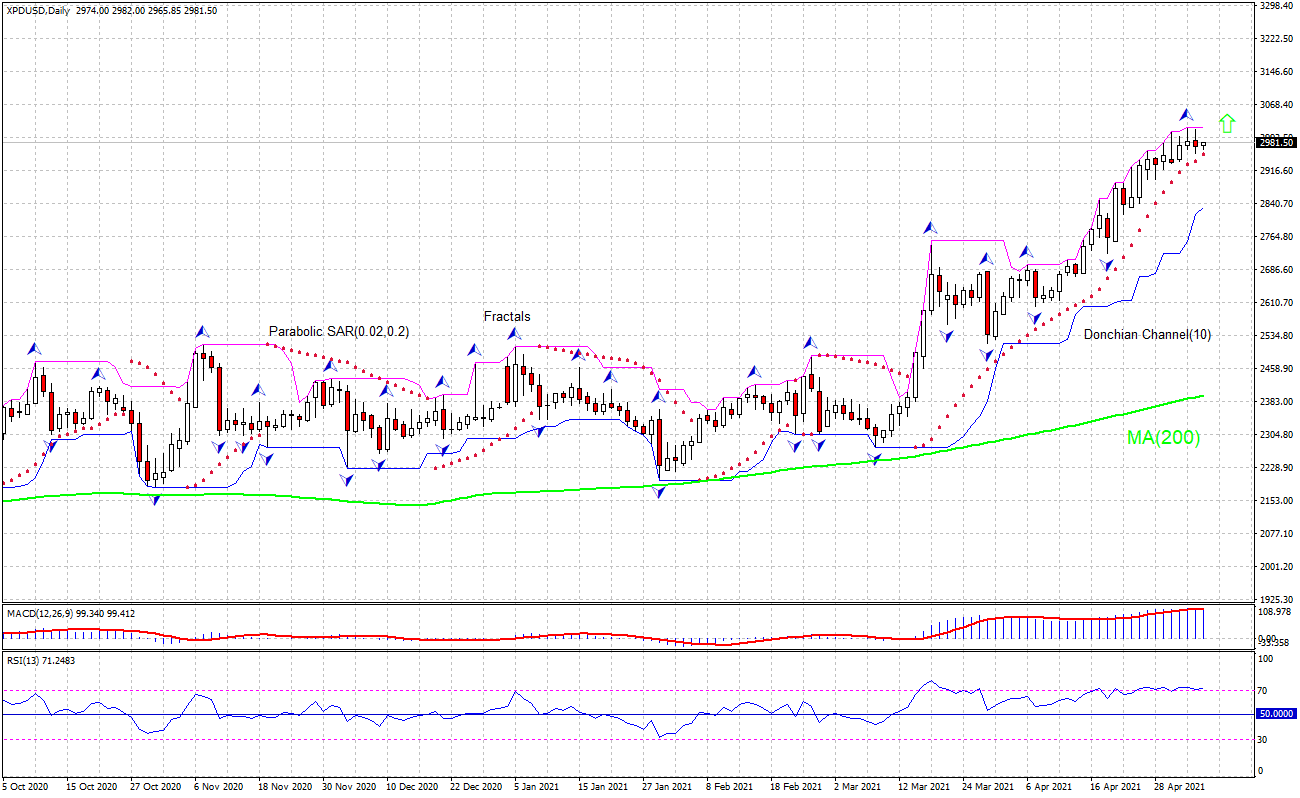
The XPDUSD technical analysis of the price chart on the daily timeframe shows XPDUSD,Daily has hit all-time high above the 200-day moving average MA(200), which is rising. We believe the bullish momentum will continue after the price breaches above the upper boundary of Donchian channel at 3017. This level can be used as an entry point for placing a pending order to buy. The stop loss can be placed below the lower Donchian boundary at 2831. After placing the order, the stop loss is to be moved every day to the next fractal low, following Parabolic signals. Thus, we are changing the expected profit/loss ratio to the breakeven point. If the price meets the stop loss level (2831) without reaching the order (3017), we recommend cancelling the order: the market has undergone internal changes which were not taken into account.
Fundamental Analysis
XPDUSD is rallying on recovery of global car sales while concerns over supply shortage of the metal persist. Will the XPDUSD continue rising? Palladium is used in catalytic converters together with platinum and rhodium to reduce pollutant discharge of car exhausts. While demand from automakers gradually improves Palladium soared to a record high on Tuesday on worries over short supplies of the metal. Concerns about supply shortages were exacerbated after top producer Nornickel announced disruptions at two mines due to flooding. Expectations of rising car sales is bullish for XPDUSD.