Technical Templates 2

Your planning begins at the analysis stage. It�s here where you�re laying down the aims & framework of your trade.

It doesn�t need to be complex or deep. A basic, easy to follow structure of what your primary intention is for the position is all you require.
It might be a short range, intra-day or intra-session foray into the market based on a one-off event (technical or fundamental).
You might be considering a slightly longer-range attempt to run your position up or down the price grid based on your overall assessment of current events.

It also might morph into a trade-off of the two.

For instance, you might well have entered say an hour after the London Open, with the sole aim of exiting the trade at a pre-defined level. However, price accelerates through your intended profit level & gathers pace. You now have the option of booking a little profit on the deal & re-structuring the position as a whole. Although you’ve entered the market with a defined plan, your preparation allows for a little flexible management.

That type of scenario, which occurs more often than not out there, is a by product of a well drilled structure.

Once you got the outline of what it is you�re looking to achieve, you can wrap your specifics (entry criteria, stop loss, staged targets etc) around the intent or framework & plan for all eventualities.

Part of those eventualities will include your get out clause. If you enter the trade & the price action fails to play ball at any time after the entry, you absolutely got to know exactly where you�re going to bail & what proportion of your position (part, full etc) is getting cashed.

Usually it will be at a level or zone that tells you you�re wrong in your initial assessment of the trade.

If you�ve already encashed partial stake & you�re looking to re-evaluate your trade, you should already be aware of what circumstances will influence your decision to re-structure the position.

This discipline & practice will ensure you�re adequately prepared & protected in the event of circumstances taking an unexpected positive or negative turn.

You should never be surprised or caught with your pants down in the market. If you get spooked or you begin to doubt your presence in a trade, then you haven�t done your homework properly.

Planning is everything in this business. If need be, prepare a basic checklist of what you need to keep you focused. Preparation is good for confidence. Don�t underestimate the benefits of a well prepared & confidently drilled game plan.

Thanks Sean.

I had a plan of sorts. My plan was to exit half where I did and then, hopefully, let the rest ride up to the 1.37 level and see what happens there. However, while I�m starting to get the hang of entries, I still struggle when it comes to trailing stops and letting trades run. How close is too close for a stop? How far away is too far? I know nobody else can answer those questions for me, but I invariably seem to jump the wrong way, in true novice style I guess. :slight_smile:

More often than not, I tuck a stop in too close, get stopped out and then watch price continue in the original direction. Definitely something I need to work on.

As it is, I had my stop tucked under 1.3550 and got stopped out earlier today.

I therefore confidently predict that we’ll see 1.37 soon� :smiley:

My first decent trade of the week. Had to fight the frustration of not entering the successful trades you guys got. Anyway, repeated failed attempts to get through the Asian high, classic James IB signal, H4 in retrace mode so consistent with the near term flows on that. Just broken through yesterdays low so have tucked my stop just above that (too much volatility recently to want to go for the big trend)


Looking at the different major pairs, I interpret that the USD is showing strength across the board right now.

At the same time, EUR shows signs of weakening or stalling against the major crosses, except JPY.

Since I’m focusing primarily on EUR/USD, I’m short biased and looking at the 1.31 support level as a possible level which price might move towards.
Unless Geithner has something to say of course that turns sentiment against USD.

Anyway, if Geithner doesn’t surprise us, I’ll be on the lookout for an opportunity to short EUR/USD.

Thoughts anyone?

Nothing wrong with your near term bias far as I can see. That pair, as with the Dollar/Yen, backed away from it�s previous weeks highs last week & the attraction is still currently to sell into rallies if you�re operating your business on a day trading basis…

Euro is back in the spotlight this week as the ECB decides how it�s going to play the rates card now, & into the near term. Risk aversion will assist the greenback, & Yen too, so lining up any technical markers with your set up criteria will pay dividends.

The girls earmarked one or two levels from a couple weeks back on the Euro that will hold good on moves back toward 1.30 & below. The Fibonacci supporters among you will be keying into that 1.3100 level as it reinforces the hard support/resistance level with the 50% of the recent March low to high leg.

I�ve grabbed one of their recent charts with the near term levels & simply pegged on those Fibonacci grids to highlight the confluence zone.

I’ve zoomed in a little on a small timeframe chart to highlight this upper Fibonacci confluence at the 3250 line which the Tokyo price activity hugged nicely into the weeks opening prints.

I think they’ve spoken previously about matching up these technical price aids alongside the hard s&r zone they utilize on a dialy basis.

Personally, I feel you’ll obtain more mileage by marrying up technical price aids in this manner. If you can uncover more than one reliable price marker on your near term radar, it offers slightly higher odds of a likely 2 way encounter next time the price action crosses swords with the level.

There are plenty of folks following these set ups out there, which tends to increse the attention on them. For ease of viewing I’ve changed the Fibonacci color to green.

First trade of the week:
Took the break of the break of IB in H1 plus the H4 candle closing above the previous day high. Move my stops to lock in some profits and see how will London perform. I feel this week European session has been rather range bound. Tomorrow is NFP day and G20 meeting ongoing. I may end my week with only one trade. :slight_smile:


I agree, you need to be particularly choosy this week with your opportunities.

That�s a nice one you picked up there though.

Keep an eye on the weekly levels too. Bounces & support off these levels, especially if the momentum is pushing it along, can also offer good low risk legs up into a move.

You also got more time to plan the trade & decide if it offers you sufficient risk to engage.
2 of the majors (Cable & Aussie) showed potential off their respective previous weekly low floors.
If you enjoy placing the inside & outside bar triggers around these common leg up zones, you�ll get a fair selection of opportunities when the momentum picks up.


Tess-

This is a very impressive thread. I just started reading part 1 to this thread and I found that very useful.

Jesus this thread is impressive! I learned a heck of a lot about how things work…it seems to me the major idea is to keep a look out for key levels, watch how the price interacts with those levels, and trade off that.

This thread seems to do a lot with putting the big picture into place, and I was wondering if you guys could recomend a similar thread on the smaller picture. I.E. When to place your actual entry, how to tell if the trend is testing the S and R levels or actually broken through, the best ways to grab the trend soon, but avoid fakeouts ect.

Of course, from reading this thread I know there is no one and universal “solution,” :smiley: However, if there was a similairly professional thread on here which kicked around different entry strategies, I would love to be pointed to it ;).

Dont often look at my local currency for opportunities but this is an interesting area coming up on the Aussie and either look for rejection off the 7200-7300 area or a break through and test of support


There are many threads around with different entry ideas. My two favourites are James 40-100 daily with the use of his IB which you will see referred to often on here and Chuck Norris’ trade the V formation. However whatever signals you use to trigger your trade, they are a lot less important than your ability to understand what the chart is telling you and having the ability to quickly identify the key action zones. In my previous post on the Aussie you will see I have started at the weekly then moved in to shorter frames. The longer timeframes show the most important interaction zones. Glad the thread is giving you some food for thought

You�re right to be focusing on your home currency in present circumstances.
Do you like to transact the AUDJPY at all?

Given the fact that for the past few weeks the dominant fundamental flavor out there has been the gradual ramp up in risk appetite, you�ve had a tremendous opportunity to ratchet the Aussie up against the Yen as that relationship has again come under close scrutiny.

Whenever risk begins to get jawboned out there, always rotate your views to the widest of the interest rate combo’s. Yen is definitely one for the radar when traders begin get itchy for a little action on the back of the risk play.

Knowing that the AUDJPY benefits from the widest rate advantage amongst the premier trading nations (currently 3.25 v/s 0.1%), & traders have been playing the risk card, it hasn�t been too difficult to unearth technical set ups to marry the fundamental flows.

Whilst most of the majors have been popping back & forth on conflicting data flow, this pair caught a clear bid off that demand zone pullback at 65.0

You’ll see a similar picture if you glance at NZDJPY too.

Folks appear to enjoy playing the inside-outside bar kicker on here? Plenty of opportunities available to get aboard via that trigger, yeah?

Technical charts are hourly examples.


I hope one or two of you are taking advantage of the price action as it keys off these usual buy-sell pressure zones, especially the s&r zones highlighted on here back in mid March (post #191) which are still solid guides on 2 way flows.

Usual repetitive inside & outside bar triggers setting up off the levels on the intraday charts to climb aboard if that floats your boat.

Plenty of downside space for price to run at should this 3250 support ledge fail to shoulder it into early NY trade.


hi guys its been a while. i finally got a minute to post. I love to see all this activity over here :smiley:

I am short the usd/jpy. I was eyeing the 100 level and it found resistance at 101ish so I am short. Honestly I still lack a bona fide trigger I just more or less am eyeing key levels and watching prices reaction at those zones.

Im still trying to get comfortable with the idea that those levels represent traders psychology and there market views wether long or short. It makes perfect sense to me.

Hi Tess,

I haven’t been trading much euro$ lately, but geppy has been treating me well this week.

Maybe I should put euro$ back on the radar? Hmm…

How’s Mark? I’m going to have to drop him an email soon.

Hey Jack.

EURUSD is pretty much a banker play. Sheer weight of participation alone generally keeps it honest back & forth thru the key (hot) price zones

He�s over here in UK now until the fall.
He was actually snouting & poking around the office at the weekend, making a nuisance of himself as usual :slight_smile:

Yeah, drop him a line or two I�m sure he�ll be pleased to hear from you.
Glad to hear the Pound/Yen is playing ball.

I don�t know whether anyone has been following the journey of the audjpy that I threw up here beginning of last week, but it�s continued to honor the stair step bias on a pullback to the last swing low trough marked up on the hourly tech sheet.

1st signs that this minor pullback from recent highs is maybe faltering can be seen around that square highlight zone, where the lower high-lower low steps begin to break down.

Price does indeed probe that prior swing low level around the 70.50, but fails to unearth sufficient profit or sell stop activity to push lower. In fact quite the opposite, as continued bullish momentum reasserts itself evidenced by that double touch higher low print (circled). That�s a decent enough primer to re-load longs, or add to existing positions, for a trip back toward recent highs, which it�s now interacting with.

Point being, these support & resistance barriers or buy-sell pressure zones are only as good as the prevailing activity that surrounds them. They�re early warning systems if you like, to pay closer attention as the price activity signals the dominant intent of the various players.

Chart 1 is the original example from back on April 6, post #305.
Chart 2, the updated & most recent activity.


My first 2 trades of the week.

TA: I have been watching these 2 pairs ranging whole day…and waiting for it to retrace / break the Trendline & Resistance…

FA: Very quiet trading day and I think its safe because no major news release…
so, I trust a lot on TA itself.

I watched both pairs break the current trendline and after closed of the 1st candle on 15mins…I go Long for both EU & EJ

[B]X[/B] = Entry

Reasonable target…not to be greedy even though it showed strong rally up in just 2candles.
T/P @ 133.50

T/P @ 1.3300
which is a quite common price level people are watching since last 2months…

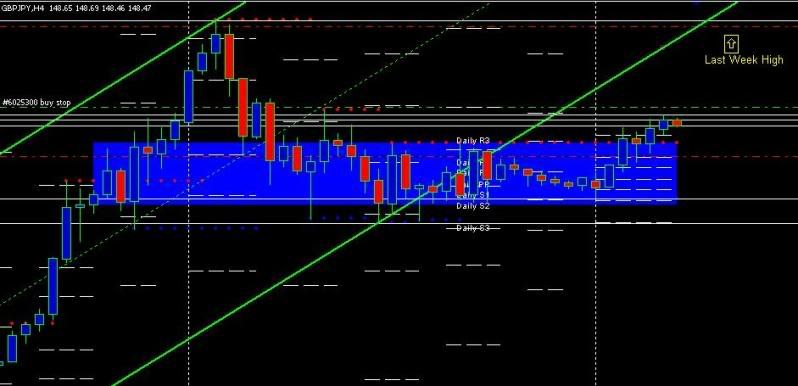
So I wanted to post my first trade of the week and get everyone’s feedback.

It is based off an overnight method that I am trying to build. The method itself is based on the H4 direction, with H1 being my entry and exit calculator. I tend to based my entries and exists off of S/R and pivots from the H1. Of course, the Daily and H4 are also used when in doubt. I do use some short term channels and a couple of indi’s as well, but took them off the chart as they are used to screen the trade more than pick any entry or exits.

Basically the intent of the trade is that I think there is a long opportunity on the GJ that will play out up to last weeks high. I look at the current channel we have been in on the H4 and think there are signs that we have broken it for the upside.

Since I like to catch momentum into a trade I like buy stops. My buy stop is placed above the recent activity at 149.00. My T/P just below last weeks high at 151.30, and my S/L is set below the latest resistance at 147.60. To be honest, I may move the T/P a little lower after we get the pivots for tomorrow, but for now I think I am in the right zone.

Please give me some feedback on this trade. The good news, is that if its a horrible idea, the order had not been executed yet.

Oh, one last thing, I try not to fidget with the trade too much as most of the action happens while I sleep. If I find that my T/P was not hit, but am in positive money when I wake up I will normally move my T/P to a reasonable place. The S/L is the same, if I see that I can secure a non-loss or profit I will do that at points, but to be honest is something I need to do more of.

Hi husky_1,

I am no expert, just sharing my views on the GY. I dun like to play the GY now as it seems to be ranging now like what you said. From the daily chart, after 07/04/09 GY has been forming smaller daily candles which seems to be inside the 07/04/09 candle. If I must really trade the GY, I will prefer a breakout of that 07/04/09 candle before going long, which is around 149.40 to 149.50 region may interest me. For the downside I will prefer a short when GY breaks and retest 145 region which I have the previous month and previous week low there. But I really like to see more confirmation signals before going long. Just a harmless thought. Tess, Jocelyn, Sean, Andre and Tony can give us a clearer picture when they shared their views on GY. :slight_smile: