i would agree with Ray there, i will be looking for a breakout from yesterdays high of 149.30 and for price to be moving up through todays R1 pivot at 149.48 with momentum. I think first target for today is 149.48 as price is at 148.60 now and then if overcomes that we can look further up.
be careful as price might find a double top at 149.30ish before reversing back towards todays CPP.
You have a plan�.plans are good!
Plans keep you focused & ensure you can identify those things that appear to work consistently & those that don�t. Therefore, disciplined planning offers you forward options.
If you don�t know what works (for you) then you can�t modify it.
I certainly agree with your bias on this pair. I too like the long stance.
This current zone (148.50) is an area of previous resistance (more easily identified via the Daily) from 4th quarter 08, & if it can consolidate & hold it, life might be a little easier for Pound Bulls.
Obviously, your entry/partial profit legs & exits are you own personal decisions & should be based around your aims, account tolerances & risk attitude � but it appears you got that covered in your plan so that�s another positive for your research/analysis box!
The main crux of any strategy play is to try identify bias in accordance with your overall intent. By that I mean short-term plays, mid-term plays & long-term plays etc. You�ve done that & your entry is based around your preferred trigger mechanisms.
If those triggers marry up positively with your usual analysis of the surroundings often enough to increase your account equity, then you�re achieving your desired aim.
I don�t think your idea is horrible at all. We all play these observations differently & what suits one player won�t necessarily suit another. If you�re happy that you�ve covered your bases & you haven�t over exposed your risk tolerance, then you can sit back & take notes on the trade to see where you might want to tweak any future modifications.
Hauling up your examples & attracting feedback is one such avenue to consider.
There is one question I have for you. You mentioned that the current channel on the 4H has been broken for the upside? Do you mean it�s been broken & you feel it�s negative for your trade? I don�t quite get what you�re saying here. If you�re probing for the long side, should price be inside your channel boundaries?? It might be that I don�t fully understand your use of these channels.
I concur with Tess� comments regards generic planning & research. We�re still contending with the risk on/risk off temperament out there for now though.
It�s swapping hats on a more or less daily basis, so you might want to rein in your outlook to match the conditions, at least until the U.S earnings season begins to settle out a bit.
Currencies (sentiment) are still very much tracking stocks & will continue to do so in the short-term at least. That means you�re going to experience quite sharp upticks in intra-week volatility that will impact on mid-term position balancing.
Pound/Yen is a b*tch to try calibrate when conditions are windy & it�s average daily range, which is generous at the best of times, can get pitched upwards of +150 pips out of whack on heightened (& intense) psychology. This will very much affect stop placement & risk management, especially if you�re ratcheting your entries & management via hourly chart references.
Just be mindful of the fundamental events currently playing out & maybe tailor your trades to suit the (current) conditions for now? It will certainly pay dividends to keep your ears to the ground (watch your flow sheets & squawk output) for general intraday bias over the next few weeks.
Just a suggestion.
Yes, unless you got the hardware to pick it off via an intraday game plan it might just pay you to keep your powder dry until it offers you a clearer view.
Maybe take a look around for opportunities on other pairs that better suit your criteria.
Occasionally price action hits a particular cycle that causes a specific strategy to get pitched & tossed around in the swell.
You need to be able to recognize these cycles & react accordingly.
That might equate to calling it a wrap on that strategy until conditions click back into gear, and/or switching hats & priming your plan B strategy (if you got one of course).
When you begin to experience difficulties in engaging your usual strategy play, it�s usually paramount to adopt the [I]“account preservation”[/I] mentality.
There�s no rules say you got to bet every day or even every week.
Know when to hold (& play), but even more smart is to know when to fold (& stay out)!
Use the markets to play to you your rules, not the other way round 
Thanks Everyone,
As the market is the final judgment it looks like my analysis was incorrect, resulting in my S/L getting hit overnight. I appreciate all of the comments and the feedback. While I traded my plan and planned my trade, it seems I have much to learn.
I see the level you guys are talking about breaking before a move to the upside would be played, but only in hindsight and honestly not sure I would have spotted this before the trade. I will take it upon myself to try and recognize these signs.
Also, I really appreciate the fundamental analysis you guys provided. My insight into the markets is not quite at that level yet. I know this is something I lack, and as I move along in my training it will be something I incorporate more and more.
Hi Tess,
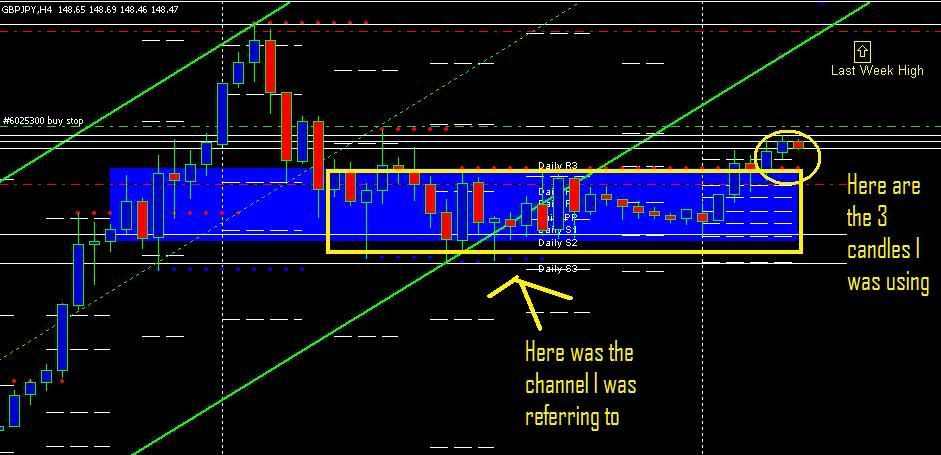
When I looked at what I thought was the S/R channel on the H4, it appeared to me that the last three candles had come out. To me this was confirmation of the long, and not what I used to signal the trade. I have marked up the chart (from last night) to highlight what I had saw. I did not draw the boxes perfectly, but I think my intentions should be apparent. Maybe not correct, but apparent none the less.
My normal use of channels include using the Shi and LRC for direction and confirmation on the H4, then using the H1 to recognize any S/R based channels to plan my entries and S/L. To answer your question above, the price is normally in the channel when I place my Limit orders above or below, depending on what I see my charts telling me.
I do apologize if my analysis was confusing, chances are its a mixture of me seeing things incorrectly, not trading in the proper manner, and not using the correct “lingo”.
-Dale
Ah ok, I see what you mean now. Your analysis isn�t confusing at all, I was eyeballing the green channel lines & assuming those were what you were referring to. My bad.
Do you use those green channel barriers as a guide to potential entry/exit junctures at all?
or are they merely additional ‘heads up’ visuals to possible trend confirmation/exhaustion?
I’m trying to get a handle on where you’re coming at regards their usage.
It�s a grizzly, choppy affair out there at the moment, & not just on the gbpjpy pairing. Actually last weeks low (145.70) back to that last major swing top at c144.50 is a pretty decent barometer of continued bullish momentum & keeps this leg honest.
Existing longs are about the only ones sitting reasonably comfortably up here with limited risk, but it resembles too much of a bad toothache attempting to get a value seat at current levels.

Hey Tess,
The Green Channels (Shi_Channel_true) are simply used as my initial guide into the direction that I will be trading. Normally price resides in the channel and will use it to also filter out longs that are close to the top, and shorts that are too close to the bottom.
Looking back, I am kicking myself because I know at the time I told myself that the price “Should” come back to the channel, and stupidly enough justified it out of the channel as additional confirmation that price wants to head up. In actuality, I should have been very scared of the long, because it broke out of the channel and has stayed out for a while. After all this is an overlay that draws itself.
I am not sure if your a fan of the whole trader psychology stuff, but this is a good example of my brain twisting what the charts are showing me because I was too anxious to trade. The good news is, I am currently reading Douglas’s “trading in the zone” to help me overcome these type of things.
Is there anyone seeing EJ 130.00 as a reversal of current downtrend?
There’s a little bit of possible s&r activity playing out around this current level, but be careful about hopping on the return ticket until you get decent confirmation.
Take a look at EURUSD & USDJPY for a heads up before triggering a long EJ trade.
EURUSD continues to display a heavy tone & Yen is still benefiting from inflows due to risk aversion rearing it’s head again overnight in Tokyo & into the early Frankfurt opening prints.
Remember what Andre said yesterday about currencies tracking stocks/news flows?
Just be careful today.

That 130-ish area turned out to be a decent bit of support with a higher low put in on the 15-min chart at 130.00 for nice long entry at 130.10 just above S1. Took a ride on that bad boy all the way to 131.30 after price put in a lower high below where I have resistance marked at 131.44/50.
Update: Looks like I may have called that lower high too quickly. Still happy with the profits.
It didn’t hurt the cause to see euro$ turn around and start heading north at the same time. Tip of the hat to Tess for the reminder to watch euro$ closely.
Good eye on that kohorok!
I think we�re all more or less reading from the same hymn sheet on the lower zones from current price level.
I got potential upside interest pencilled in around the 131.0 area (rectangular box) & last weeks high at 134.29, which also tick boxes a prior resistance level from mid March.
Next downside interest level for me is that late March reaction zone that stretches back to the previous resistance range ceiling (1st highlighted zone) at circa125.70.
From there it exposes the floor of that box range (2nd highlighted zone) as next probable decision points on continued bearish momentum.

Kind of quiet here.
I’ll try to liven it up by suggesting that the three euro pairs, gbp, jpy and usd look like they may be worth shorting.
It’s late, and I’m to tired to write it all again, but I’ve written a bit more on my own thread on these potential trades: 301 Moved Permanently
I hope it’s not perceived as lazy or bad manners to point to my thread like this, if so, let me know and I’ll edit this post.
Anyway, I’d be very happy about any feedback.
It�s all pretty much a case of repeating the same old usual stuff which is right there on the charts mh.
The technicals are all set out & visible on the EURUSD as per the recent chart examples that have been posted over the past couple weeks.
The pair danced around that 1st level at 1.3090 as London wound down for the day, offering a little profit taking & re-adjustments on the shorts for intraday players.
Sentiment was biased toward risk aversion (positive $ & Yen) on the back of weekend chatter over Financial regulators upcoming stress tests likely to affect the top tier banks, & any potential negative rumors will always drive money to the safety nets, especially in the current climate. Add into the mix, all the noise over this swine flu pandemic & you got enough fun & games playing out to upset the apple cart LOL
A case of working all that chatter & activity into your technical plans to see where the likely next pit stops are waiting.
Got a minor shoulder at the 1.3090 before slipping to next support zone down at the 1.2990/1.30 big figure where it�s attracting support all the way thru Tokyo & into the early European prints.
EURJPY also flirted with a highly visible s&r zone at last weeks low (126.07).
If you scroll back on a large hourly you�ll see that zone attracted decent participation during late Feb/early March, got pitched again on March 30 and again shouldered the action last week.
I guess for those seeking a lower risk play, (if they sat out yesterdays activity) then last weeks low marker is/was a pretty decent value play to the continued short side?
Hey this would be a bit of a tangent or rather random dot from the topic here but I’m looking to get back in to forex using a longer term strategy having made some pretty big losses from ‘scalping’ (gambling?) cfds and forex on the 1-5-15 min scales. It was pretty much a string made up of small wins and bigger losses.
I read through the alternative templates summary pdf and boy was it really long - but really helpful. Got to say thanks Tess/crew/posters for keeping it so alive and informative. Just wanted to know what kind of tolerance would you guys tend to use in a single trade in practice, i.e. what kind of gap do you guys use as a stop loss. The reason I was drawn to short term trades was partly the fast profits but also that I felt I didn’t have enough threshold for a huge swing against my position
I don�t know about you, but I (& the same goes for Tessa etc) tend to view any type of stop-loss (protective) measure as a back-up to let me know that the reason I�m live in a position no longer holds water.
That stop-loss level will (should) depend on the technical zone of entry & the aim or intention of the trade.
It could be as small as 20 or 30 pips, it could be as wide as 100 pips. The tolerance isn�t a fixed or standardized number, rather it forms part & parcel of the overall trade construction, geared toward the specific intent & make-up of the trade.
To me, if the stop gets fired off, whether it�s an emergency exit or merely a profit (trailing) trigger, it informs me I either got my timing out of kilter, I’m satisfied that the position is cooked, or my bias is completely wrong for the type of position I�m undertaking.
It will also have a bearing on the type(s) of strategies or models you utilize.
I guess if you�re keying in via some kind of breakout play (timeframe dependant of course), then your risk & trade management tolerance is going to look different than it would if you were triggering via a continuation or reversal set-up?
The triggers you utilize will also have a key bearing on what type of risk tolerance you�re looking to adopt. Your overall risk attitude will likely carry a higher/lower grading than mine or Tessa�s, for a particular set-up or trade entry zone.
It�s a pretty contentious issue & one that will draw many conflicting views & opinions.
Havent thrown up a trade for awhile but this has turned out nicely today. It combines a number of things I have learnt over my time at Bpips most especially an observation of what appears to be going on. EU appears to be trending sedately and after a 78.6 retrace on the H4 turned up again. Recently it has tended to start its move in the Asian session. So took half a position at 1 when the strong up candle seemed to signal the end of the retrace after yesterdays move. This also positioned me ready for the challenge at yesterdays high. The second part of the position was opened at 2 as the resistance became support at yesterdays high and I have used an inside bar at 3 as an exit signal for half my position. I have moved my stop under the last retracement low as its bedtime and I want to see if the FOMC gives me a ride higher tonight without putting too much of muy profits at risk

I like your simplistic thought process when working off these levels.
If you dial out (an hourly reference will show it just fine) further re; yesterdays high, you’ll see how it slices through some support/resistance divide zones from late March & most of April.
It’s ridiculous how often price butts & rejects common reaction zones on an intraday & intraweek basis, allowing for these common (prev day & week high-low reactors) levels to react again & again in a consistent manner.
Match them up with a sensible trigger & you got a neat risk play to get stuck into!
Who needs a barrow load of indicators to get you aboard huh?
Another of those interesting levels now in view which has played a part in both of the last 2 quarters. I shall be looking for both signs of continuation or rejection off this level to help me decide whether to exit or add to my trade position. No follow through so far from the move down after FOMC so the near term bias remains up


Since this thread has been slow, I thought I would ask a question.
How do you guys feel about pivots. I have had these on my charts for a long time and just recently started to feel that they are a decent form estimating an intraday move. Maybe not the whole move, but at least a stop off or reversal point.
Here is what I am thinking. Say that the daily trend is up, Price crossed up through the daily pivot, and is now 50% of the way to R1, it seems like placing a limit order somewhere about the 50% mark, with a T/P 10-15 points before the R1 would a pretty decent play. After looking at a lot of charts, the general rule of thumb I see is that price “tends” to play nicely to the PP. Of course anything can happen, and sometimes it just ignores them, reverses and would hit a stop.
The problem, of course, is that your R/R is not that great, maybe 1:1 at best unless there is some clear support area between your entry and the PP is seen. I think (and could be wrong) this may be manageable if your win percentage is good, and of course your MM is proper.
Also, I do not think this is a set it and forget type of trade, nor should it be mechanical because taking into account forces like news driven surges, random walking and overall “resistance zones” may come into play.
Opinions?
[I]How do you guys feel about pivots. I have had these on my charts for a long time and just recently started to feel that they are a decent form estimating an intraday move[/I]
Hi Husky,
None of us observe them, so unfortunately we’re not going to be of much use regards feedback.
We simply prefer to observe & plot the support-resistance zones via the methods shown on our chart examples.
[I]After looking at a lot of charts, the general rule of thumb I see is that price “tends” to play nicely to the PP. Of course anything can happen, and sometimes it just ignores them, reverses and would hit a stop[/I]
As long as you can identify your risk tolerances & manage the positions effectively, then I guess the results from your research & testing across differing market conditions will inform you whether observing & triggering in-line with pivots has mileage?
[I]Also, I do not think this is a set it and forget type of trade, nor should it be mechanical because taking into account forces like news driven surges, random walking and overall “resistance zones” may come into play [/I]
That will certainly be the case if you’re basing the majority of your trade executions via the faster, sub hourly timeframe view.
It won’t be such a chore (once the position is net positive & bedded in) to babysit your trades off the slightly longer timeframe angle.