Technical Templates 2

There is a lot to learn from the people who have been posting on this thread such as looking at the old posts and also on the original thread… but it seems more interesting to read new posts that are applying similar principles to current trading… (at least to me…).

And there is a benefit to be derived from watching how different people apply similar strategies…

Thanks again

dave

Price is now flirting with the outer edge of the lower zone mentioned back on Sunday�s heads up post.

http://forums.babypips.com/free-forex-trading-systems/25839-my-basic-chart-analysis-method-10.html

That 154.75 fulcrum has been a decent (short) barometer this week, with price breaking through & re-testing the area yesterday, ensuring you trigger in line with the value odds of shorting rallies in step with the dominant flows.

Next downside heads up focuses the 147.50-146.75 zone ahead of that visible swing low at the 143.0

This lower zone between here (151.50) & the next drop level at 147.50 looks quite busy, having supported & capped the price action all the way through April & May, but if the momentum guns it further down through this current level you can continue to use the lower highs & lows to key in off your favored triggers.

I feel this thread is a valuable thread for anyone who wants to take forex seriously. In addition the materials imparted here can be used on any timeframes. Recently, I have moved to trading longer timeframes like the daily and weekly charts, it make trading more relaxed and more time for other stuffs. :slight_smile:

What are you going to do on the 4 hour or Daily chart timeframe?
You got a specific strategy or game play worked out that returns a potentially greater value to risk ratio via those timeframes than the lower timeframe options?

hey andre i can tell you why i prefer the 4h and daily tf’s

first it is that i feel price patterns, trendlines, all manner of analysis for that matter is more stable and truer on higher timeframes. this doesnt mean i wouldn’t drill down to find the best entry on the 5m tf.

also it is an availabilty issue for me. i am not always able to “daytrade”

also i feel i can risk very little to gain very much just by sensible use of these s/r zones. especially on longer tf’s

No no, I was just throwing those questions/comments out there to get a little feedback about where edacsac was going with his thought process is all � not meant to be a deep & meaningful chin scratcher!

Let me give you an example of where I�m coming from with my last comments:

We�ve been looking at the pound/yen this week yeah?
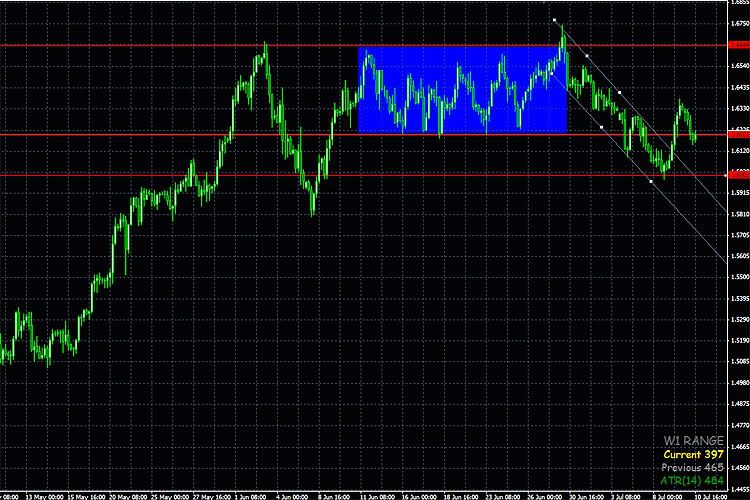
I threw up a chart last Sunday on here: http://forums.babypips.com/free-forex-trading-systems/25839-my-basic-chart-analysis-method-10.html and a couple more follow ups on here as it developed, with one or two level/zone markers that piqued my interest & would tempt me if they reacted.

Those zones were marked off via a 4 hour chart reference study.
So, given I highlighted the zones & considered them worthy of careful inspection next time price knocked their door, what do you suppose I�d be looking for if & when they touched base?

Lets take just one of those levels in isolation & drill down into the specifics to open it out a little.

Hopefully it will offer up more detail about why we wait for particular opportunities & the kind of basic stuff we continually monitor to reinforce the decision making process.

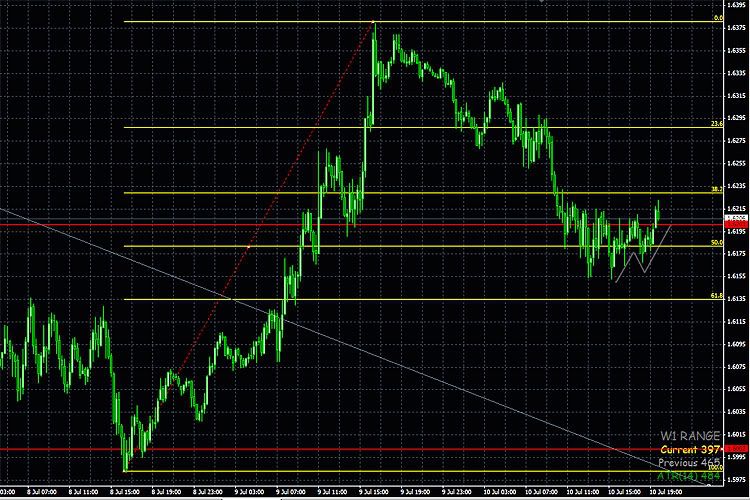
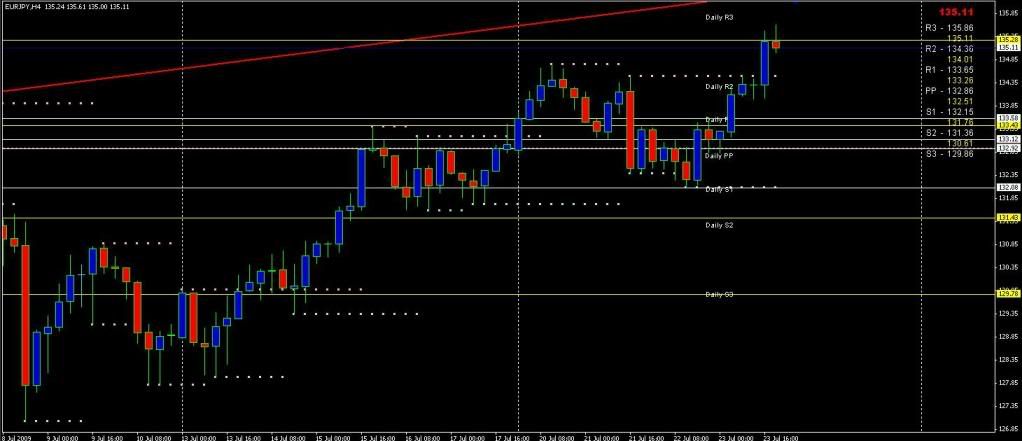
Price arrived at the 151.50 level at 4.00am London on Wednesday & spent over 11 hours arguing with it before plunging 475 pips in less than 2 hours down to a pre-mapped level that was responsible for shipping price North quite smartly only 2 months previously.

So, this was the 1st test of that potential demand zone this time around.

475 pips in a heartbeat, to a typical reaction level we highlight on here constantly.
Price had travelled over 500 pips already that day & arrived at 146.75 as London was closing up shop for the day.

Average range for the 10 & 20 day prints are striking in at the 290 pips level.

What do you suppose the odds are that a bounce was likely at that previously identified s&r level?

If the level/zone is a potentially hot potato & it begins to display behavior traits that typically develop into a playable high odds/low risk trigger, then does it really matter which timeframe you key in off?

I�m not suggesting this is right & what you guys plan to do is wrong or inferior � I�m just putting it out there to see what bubbles to the surface!

Ok, I got a conf call to get stuck into. Enjoy your weekends!

Small timeframe option:

Larger (4 hour) timeframe option.

Nice example. Less risk and much greater reward entering on the smaller time frame. At first the nice IB on the greater timeframe looks safer, but the smaller timeframe gets you in sooner with less of stop loss… if I see it correctly.

what i see is you have entry points at support where it became resistance. this is what I look for and sometimes refer to price pivot zones. these areas always act the same and can be very reliable in your analysis. when price moves through these levels you can safely tuck your stop behind the last “entry point” and trail your stop all the way across.

To tell you the truth andre I don’t feel that I am good enough and “nimble” enough to risk my hard earned capitol on lower timeframes and I definatly would be more comfortable on at least H1. The way that I trade and the things I lok for in the markets are far more reliable on higher timeframes. Although I would definatly agree that price is price no matter what.

After checking out the Sunday Breakout strategy and setting up some lines on the GBPUSD, I thought I would look a bit deeper, to see which direction a breakout seems more probable, and setup a plan for next week. I’ll take a crack at sharing my thoughts on the 4H and 15M for the sake of discussion and see if I can improve my thought process.

I plotted 3 lines as some sort of S&R zones, but I don’t see them as very relevant historically and seem week even as scalp lines. But they did help me identify an area of recent consolidation and a subsequent trend that appears to have run out of juice, turning toward a possible new uptrend and possibly completing a reverse head and shoulders pattern (psychologically significant?). Less significant but still worth mentioning is the hesitation running up to 1.600 in late May.

Fridays close at 1.602 looks to be respecting the 1.600 area that created support for the previous consolidation area, and coincidentally resides close to the 50% fib of the most recent low/high. Drilling down to the 15M chart reveals to me a touch down inside the 50 to 61.8 retracement zone (sorry if I drew it backwards. In this case it works for me either way.), a really vague but complete reverse head and shoulders, and a possible ascent toward higher highs and higher lows.

I might be reading more out of this then whats really there, but I think I see alot of neat things happening. If there is truely a long developing I would look for either 1.625 area as an entry point as there seems to be a touch of support and resistance there, or a signal around 1.635 to confirm my make believe reverse head and shoulders. If price turns the other way, I’d probably go look at another pair.

This is what I’m thinking from from what I’ve been gathering as a newb. Whether applied correctly or not is a whole 'nother story! Hopefully it will add positively to the topic.

A good example of that is the current state of play on the Cable.

It blends in nicely with your analysis of this pair & If it helps to add a little flavor to your Cable pot, then all well & good.

This isn’t my work, it’s Jimmy�s (JimmyMac) take on it.

He boxed 2 visible reactionary zones back in early June after the price action appeared ready to build momentum to fresh yearly highs from the ascent off the late April/early May move up.

The strength at which price rejected both zones in early June, (1&2 on the 1st chart) signified decent reverse orders likely on any future re-visits.

Waiting until the market vibrates the upper or lower reversal zones (where it�s already proven to be most active) is likely to offer a potentially higher value/lower risk ticket to test the validity of the range, at least until it breaks out either through the top or the bottom tier of the identified barriers.

Those upper & lower barriers were/are then primers for him to drill down to the lower timeframe of his choice (either a 15 or 5minute grid) & wait for an appropriate trigger to get aboard.


There have been 2 further tests of the upper tier during the last week of June & the price action again finds itself mid range, slopping around aimlessly inside the well bracketed upper & lower tiers of the range.

There won�t be any further deals considered on intraday visits until the action once more vibrates either end of those identified tiers.

Those are the types of reactionary behavior he/we like to witness during these market cycle phases.
Strong buy-sell pressure zones where we can begin to calibrate lower risk/higher odds bets. If we have to wait until the activity rolls around into one of our hitting zones, then so be it.

Once the zones are marked up they�ll be left in place for as long as the market continues to honor them.
Obviously we�ll eventually get unseated due to a change in market rhythm (breakout of the range tier).
That will be the signal to change hats & adopt a more appropriate set-up/trigger/management combo in line with the market pulse.

In the meantime, while we�re waiting for this pair to stroll into our hitting zone, we�ll take a leisurely walk elsewhere to see what�s setting up.

Thanks Andre thats a nice post. Regards to Jimmy

Yes thanks! I didn’t see the 1.5900 for all that it could be. I almost sat down on a 3 legged chair!

Passed on & reciprocated :wink:

Well, it�s just his take on it edacsac. It’s by no means the only playable option.
Everyone will have their own interpretation of what constitutes a fair value bet.

You only need to compress a couple weeks worth of data on a 15minute chart grid to see the each-way trending opportunities inside those upper & lower barriers.

There�s a whole bunch of potential profit to be had inside the larger ranges if you got the skills & temperament to do battle down at that level. Which is where tools such as previous day & week high-low markers & average daily range prints etc can prove helpful in offering a little balance & direction.

Of course, the lower down the timeframe scale you go, the less margin for error you got, especially if you�re unprepared or unfamiliar with the surroundings.
But for those who possess the skills to regularly identify & calibrate effective value/risk opportunities, then it�s fair game.

Trouble is, most folks new to this environment usually heavily underestimate the work & skill set required to constantly operate out of those faster timeframe grids.
It�s not a place for the faint of heart or ill-equipped.
Most end up paralysed in the middle of the road - rabbits caught in the headlights.

In keeping with observing this pairs recent activity (& in my absence yesterday) one of the guys took this snag of Pound/Yen as it broke out through Tokyo high prints in typical continuation mode with the early London trading week flows.

Positive overnight asian/early european equity markets offered a lift to risk appetite, inspiring possible further upside potential in this pair.

So, putting the basic ground rules into action:

� You got local s&r markers or guides to bounce off (prev session high-lows etc)
� You�re looking to trigger in step with momentum flows & in-line with increased liquidity (London activity)
� You got decent, visible (risk) swing levels to tuck your stops away whilst the market goes about it�s business.
� You got clearly visible upside levels to aim at as the market gains legs.

� Once/if it decides to play ball, you can trail profit stops up underneath the mini-swing steps as/if the activity attracts fresh legs.

You can also tentatively gauge the likely destination of upside potential by referencing the pairs average daily & weekly range prints.

Yesterday’s chart snag:

Tuesday wasn�t exactly a high performance session, with this pair printing just 70% of it�s average 10/20 day range, but it maintained the upside break of yesterdays Tokyo shift & was supported at the Tokyo low as price re-tested the range step into early NY trade.

Stops below the obvious mini swing low (highlighted on the above chart) was sufficient to allow the price action room to attract & quantify demand potential.

See how yesterday�s session high-low markers have now tagged a couple of previous �resistance turned support & support turned resistance� zones? (chart below).

These regional price extreme & swing levels consistently act as magnets & holding points as price ratchets up & down the ladder.
They�re also more likely to harbour trailing & profit stops, particularly if the market moves aggressively away from these levels & drops back to test the flows & participation.

Todays updated chart:

You got a similar scenario playing out on the Euro this morning.
I haven�t triggered this by the way, just hauling it up as a typical set-up play.

Price getting slowed at last weeks high after bolting out of the gate into the early Frankfurt prints.

Prices are quite obviously mired in a range, but it popped up off Mondays lows yesterday around that 1.3900 level.

I guess if you were of the view that prices having found a little support (& participation) on that lower test, & this upper barrier at the 4070 zone was worthy of a value punt, then keying in via the aggressive shift up into those early European prints through yesterdays high would make sense?

If you missed the initial pop, you got a second bite as it slipped back?
Which is now ticked as a short-range support barrier to check upside potential.

Again, it�ll all boil down to what the individual perceives as value v/s risk I guess. But it mirrors the typical example of price action behavior discussed & highlighted on here.

Anyhow, just an observation is all.

Pound/Yen ran out of gas right up there at that highlighted zone yesterday as the New York desks lost interest into afternoon trade.

Yesterday�s chart snag

Again, it fell a little short of its average daily range prints (registering 87% of the recent 10-20 day returns). But that level was a pretty loud blip on the radar, so a good enough spot to book profits I guess.
Yesterday�s low print (152.37) flags up an area of likely turbulance should it get shoved back that far in today�s trade, failing that clear upside markers are in evidence to aim at if you get triggered into further upside continuation bets.

Today’s updated chart

Smaller timeframe view amplifies the nice orderly stair-step move up that never really forced your hand if you were onboard this leg.

That�s the type of price action you really want to see when you�re onboard a sturdy move like that. 1st heads up that this thing was running out gas up there was the failure to continue printing higher highs & higher lows (circled).

Common sense really.
Time of day/previous reaction zone/amount of miles travelled. All adds up to considering cashing out & sitting back to see how it plays out.

Turns out GBPJPY did decide to climb after all, testing 156.50 right now. I don’t get how anyone would have the nuts to stay in a full run of anything during this period lol.

Anyway I had a question about charting feeds in general and google hasn’t managed to yield any answers or I’m just not searching correctly: wouldn’t using a platform based on marketmaker feed/spreads skew our charting signals and boundaries? Surely instituitions trading via interbank networks who (presumably) make up the bulk of trading volume wouldn’t be basing their trades on retail marketmaker feeds. Should we try to grab ecn sources instead?

We’re still in “hit & run” mode Shaun. Only 2 (shorts) bets this week on the Cable + one on this pair that we actually picked up again today on the strong punch through last weeks high.
You got to be choosy how & where you play them, but there are decent value pitches if you wait for the optimum punt.

typo: should read 156.20-50

I wouldn�t concern yourself too much with all the jawboning around chart feeds in relation to the cash (spot) markets. The difference is less than minimal & certainly won�t unduly impact your work or technical research models.

Zones are zones are zones.
They�ll show up the same on whatever chart feed you�re observing.

If you�re stressing over a few pips discrepancy on a s&r line tag, then you�re looking at this gig through the wrong viewfinder.

Focus more on the general vicinity & bias of the price action & why its playing out at the various stages on the technical map rather than fannying around with precise or exact boundaries & support/resistance lines.

See if they can keep the ‘risk acceptance’ tap turned on into the final shift of the trading week tomorrow.
We get to see how the 1st read on the UK GDP sheet looks at 4.30am EDT, that usually forces the profit-taking hand if prices have gotten extended prior to the print.

One or two zonal reference tags I’m looking at up & downwind of the current price level.

Short-range

Mid-range

Shaun,
I am also finding that trades are hard to come by right now, I have only had one open trade this week on the EU, and it was a for a pretty small amount. Hindsight says I could have pulled more out of it, but when the pair has been in such a flat move as it has been for few days, I was scared of a break out in the wrong direction.

Andre,
When you guys move down to the lower time frames, I assume you may start adding some more zones based on those lower time frames as well. Normally I trade the h4 with my zones being determined from the Weekly, Daily and anything really strong on the h4. If move down the h1, I assume I should then also look at h1 reaction, as well as previous day high/low close etc.

Here is something I am looking at, which is a possible setup on the EJ, but it would be counter trend, so I would have to have a pretty strong bearish engulfing or star for me to consider entering. The problem with that if it is strong then my R/R may not be there. If its weak, then I would look for a bounce off of the 133.50 area to enter a long.
Opinions?

Oh, one last thing. Even though my success (or lack there of) in trading is not necessarily a reflection of it, it really is amazing how these zones get obeyed a lot. On the previous chart those lines were drawn no less than 2 weeks ago.

When you guys move down to the lower time frames, I assume you may start adding some more zones based on those lower time frames as well

Not really Dale. Not unless a highly visible or obvious area blips extra loud on the smaller timeframe radar.

The major buy-sell pressure zones we typically identify via a 240 or 60minute tag will be the primary focus area for our activity, as will the previous day & week high-low barriers & the manner in which the price action sets up & gets hoofed on & around those levels

As price moves toward & vibrates our pre-defined levels we�ll begin to discuss & plan the most appropriate (including risk to value odds) means of executing & managing the potential position(s). We�re very choosy what we trade & how/why we trade it.

Depending on the current market pulse or rhythm (trend/range), the risk flavors influencing the near-term action, the main fundamental drivers at play, day-on-day liquidity levels, contacts/wire chatter etc etc�will get stirred into the pot & the decision will be made as to which pair(s) offer the premium bang for our buck.

Here is something I am looking at, which is a possible setup on the EJ, but it would be counter trend, so I would have to have a pretty strong bearish engulfing or star for me to consider entering.
The problem with that if it is strong then my R/R may not be there. If its weak, then I would look for a bounce off of the 133.50 area to enter a long

I�ve only just read your post, so I�m a little late to the gig.
Would you call that 4 hourly collection of potential rejection/bearish activity worthy of popping your cigar into the ash tray & pulling up a chair??

I don’t really know what your interpretation of strong or weak is?!
It might not marry up with my take on a particular angle.

The same identification level on your hourly frame is simply cascaded down through the relevant timeframe grids.
It shows up clear as a bell on all the smaller frames.
You just have to choose which one to reference/trigger/execute & set your risk parameter play off.