Thanks DoubleEcho, a bit of confirmation from a professional is very helpful.
Certainly, I would be more inclined to wait for a break lower of this zone and take 15M hooks to the downside targeting 1.25 and 1.24.
Cheers
S
Thanks DoubleEcho, a bit of confirmation from a professional is very helpful.
Certainly, I would be more inclined to wait for a break lower of this zone and take 15M hooks to the downside targeting 1.25 and 1.24.
Cheers
S
Depending on your risk attitude, playing each-way bets out of these pre-identified S&R zones is another option providing of course you can compute & locate acceptable stop-loss & reward placement.
That pair has covered its 3 month average range this morning in european trade & the dominant bias coming into this topping action during April remains bullish.
Just an alternative suggestion to throw out there.
That’s a dirty, smelly old support/resistance zone though isn’t it.
Look at a big hourly chart & this zone really is the last chance saloon for bulls on this pair. Big, broad head & shoulder formation with a clean neck line right around this 1.2600-1.2630 area.
Urrrghh!
Ha, yeah.
Wouldn’t disagree with that view.
One or two of these pairs require a red hot poker insertion where the sun don’t shine.
Early 2nd quarter lethary. Well, that’s my take anyway 
So you guys are saying this 2600-30 area wouldn’t rank as a high probability level from which to trigger a bet?
Is it because although the medium term trend on this pair is bullish, it’s currently being driven on the back of bearish sentiment?
I’m using Andy Perry’s 3 Ducks trend definition as my generic guide & that is currently erring on the bearish side with price underneath both 4 & 1 hour averages. I’ve used these previously highlighted s&r levels that I posted here on the 3rd as entry confirmation to compliment my trend view. I realise this is trading against the meduim term bias, but my reasoning was based around the price action backing off the bearish sloping moving averages, whilst encountering resistance at the identified s&r zone.
I didn’t trade Monday due to the bank holiday, so the first short opportunity for me on this pair set up yesterday when price again pulled back into 2730-50 & dropped through the next higher low at 2722 which is a 1-2-3 set up too.
I’m rightly or wrongly still viewing this pair as short term bearish until it once again breaks back above the upper s&r zone of 2725-55 when it will have pushed through the moving average on the 4 hour & 1 hour charts again & potentially negated this bearish bias?
No, not at all.
I personally don’t rate it as a high probability long bet at the present time because of the reasons mentioned in my reply to Steve. But that’s just my view.
You (& I) have to appreciate there are others who will view this typical area as a low risk/high probability bet for any number of reasons. One might be because the zone, having being rejected in February, then acted as support during early March & is currently attracting support this week in the context of a mid-term bullish bias.
When prices encounter zones such as this & the one above at c1.2725-35 they will butt up against 2 way action in the way of limit orders, trailing profit stop, & dependant on the level from which it’s engaging, bids & offers.
Each camp will determine it as either a level to cash out (partially or fully) or a level to engage against the flow. Some traders will be cashing out short bets down here to check for continuation potential & they will be mixed in with fresh bids from those checking out the strength of another pop back up to attack the recent highs.
There will be sell stops building underneath 2600 to check out the potential to hit 1.2400, the next visible zone of prior activity that Steve highlighted on his chart. And those conflicting orders will take time to settle out & pick up the slack.
You have a structure that is offering you a disciplined view of the price action.
When that structure comes into play & offers you a green light to engage, then as long as you can compute acceptable risk & can clearly identify a level or levels to aim for that will offer you options if it manages to get there, then you’re ok to lay your bet.
The fact it disagrees with my view or anyone else’s view is irrelevant.
It all comes down to risk attitude, aims & objectives, & everyone’s is different.
You’re using a mechanical structure alongside a discretionary framework to enhance your probability odds & if you can comfortably slot those two elements together & generate a positive expectancy, then good for you.
It’s been said on here many times, but there’s no right or wrong.
Only what’s right for you.
That was a good bet by the way!
And presumably if you’re not already short when price breaks through & continues on down, you could take short trade from a pullback to the breakout zone mentioned.
You could.
Or alternatively you could short this lazy move up & get in ahead of any potential continuation breakout through the round number.
Problem waiting for pullbacks is sometimes they never arrive.
So you could do as stated above, or you could feed into a break by splitting up your stake.
Part in on the initial push, remainder in on confirmation of the break.
There are risks with either option. Just depends on your interpretation of what constitutes value.
Considering your comments regarding positive Australian & Chinese data & it’s effects on the associated currencies, I’m going to focus on AUD/JPY as a major recipient of that type of bullish output.
The wide interest rate differential between those two will positively impact that pair & if I’m not mistaken offer a lift, albeit temporary, to the rest of the traditional risk based currency pairs.
So I’m thinking I might obtain more lucrative opportunities by zoning into that pair with the added bonus of carrying a respectable average daily range to enhance its intraday prospects too.
I’ve marked out 2 lower S&R zones to be aware of next time around & will look to get in on pullbacks in accordance with my 4 & 1 hour moving average guides.
I note there is some potentially high impact Chinese data (GDP) being released onto the market later tonight London time. I’ll be around for that & will observe how the market reacts & filters it in respect to the already bullish Australian momentum.

You were right about the low probability long view last week DoubleEcho.
Cator’s comments about getting in ahead of this 1.26 round number proved correct too as evidenced by Friday’s price action. I can see how that sort of tactic in these circumstances would help to counterbalance the whippy price action usually present around these volatile levels.
The 4 & 1 hour averages continued to confirm the short bias into Thursday & Friday too, but thank you both for your additional comments & views. Very helpful.
I note AUD/JPY has also reverted to form this morning
I don’t think it’s just confined to the majors Matt. Most of the trendy (cross) pairs of late such as gbp/aud, aud/jpy, aud/cad, eur/ndz etc have capped their runs & become tied up at longer range respective s&r levels during the past couple of weeks.
I notice over on the templates thread at FSR there hasn’t been so much of a mention of eur/usd or the other majors for a few weeks now. I guess it’s just easier to take bites out of pairs offering up the simpler set ups & triggers.
The concept plays out just as consistently on the crosses as it does on the majors.
The ranges on most of the majors have tightened up quite significantly lately Matt, which will knock onto quality & performance, especially if you’re geared more toward intraday bets.
For example, if you use their 3 month average giuide, EUR/USD has contracted nearly 25% since February & the others are in similar territory. It doesn’t appear to have affected the larger range cross pairs as negatively which goes some way to explaining cator’s comment about switching emphasis.
But then, that outlook & trading those instruments would be more biased towards longer term bets as opposed to intraday.
The impression I’ve got from their content & material is a strong bias towards obtaining a value entry from the use of top down, multi-timeframe observation & establishing a core position where you have the opportunity to actively manage the bet using the tools (such as daily & weekly average range, directional momentum bias, s&r zones) at your disposal.
I would disagree that it’s primarily a longer term trade structure, because quite clearly the dual timeframe approach & the core framework can be applied just as efficiently on an intraday basis providing you maximize the key primers such as available daily range, entry trigger & directional bias.
You certainly have to be very aware of periods of range contraction/expansion & increased intraday volatility influences, because they will have a very crucial impact on your intraday risk exposure, but there are definitely periods when this concept & structure lends itself very well to picking off exceptionally good value intraday trades.
They continually advise to cut the cloth of the information they’ve provided accordingly. It’s basically a robust, minimalist framework from which to adapt & hone your own preferred style & risk model. But from what I’ve read & witnessed, it works effectively from both angles.
You’re right Matt, even if one possesses a very acceptable intraday model there won’t be opportunities to trade it every day for any number of differing reasons. Like anything else, it has to be applied only when the edge (or odds) are positively stacked in one’s favour.
I don’t know about you, but I certainly wouldn’t touch a pair on an intraday basis with an average daily range as low as 64 pips. That is one pair that most definitely slots into the longer term trade category. It would need to be registering at least +100 pips per day to even begin to get me interested in taking on an intraday position.
I do concur with your comment about the best intraday trades also setting up alongside longer term opportunities however, but again, as has been touched on by other posters, it all boils down to trading objectives, duration preference & risk attitude when it comes to how one executes & manages the bet.
For those interested, there are still a very regular selection of great 4 hour hook entries triggering with the dominant trend on most of the available pairs, as I’m sure you’ve witnessed 
I clocked your thread bump post before they quickly deleted it kagein.
I’m pretty sure they won’t allow that kind of thing unless it’s a valid & bona fide contribution, regardless how high a quality thread you think it is
Had you posted up a basic re-affirmation of the standard structure with an accompanying graphic highlighting your commentary, that would have sufficed.
Thing is though it’s simply repeating what’s already been submitted. Nothing really should have changed.
Those who are laying out their workspace based on what’s inside the threads are more than aware which direction they should be trading & exactly where on the technical chart the higher probability reactions will be to either get in, scale out or consider bailing if the bias is about to come under pressure.
But I do understand your reasons for wanting to bump quality threads.
You just need to be a bit more creative when doing so

Ok, so I understand that if price breaks out above the first shaded area then it’s probably going to try & generate momentum onto your second shaded support & resistance zone at 1.2300 & 1.2350.
I also see the significance of plotting those zones & the price has been resisted at the lower area for the past three hours, so it’s a valid level, but what would you personally look for in order to make a decision to enter a short back with the trend or perhaps pull any short trades already placed?
Thanks.
For starters I can drill down a little to get a closer look at the price action leading into that 2160-90 zone.
From the lower timeframe view I can see a bullish stair-step climb (putting in higher highs & higher lows) right into the highlighted area where it then stalls out & fails to print a higher high.

That basic information tells me the zone is resisting for the time being, & until it breaks out & confirms the push up through yesterday’s lows, any trailing short stops from further back are safe & there’s no reason for anyone to become panicked about closing out.
Time of day would be a big influence for me personally. I’d much rather make my decisions when the european market opens & gets busy rather than messing around in low volume activity, but that’s just me. So if that zone had come into view an hour or so into the European open I’d have been way more inclined to get involved.
Vicinity to the average day’s range is an important consideration too.
I wouldn’t particularly be inclined to take an intraday entry if a good percentage of the range had already been covered.
But if you were holding a gun to my head & wanted to know where I would consider shorting on the current price action grid, then I would always wait for a pullback (with the bias or trend) to a pre-identified s&r zone, typically right around where price has just been resisted.
If you read the material on here carefully & take notes of the key criteria they’ve posted so repetitively, you’ll see mentiuon of trading on & around zones that always offer you higher probability/lower potential risk.
That’s where it’s at.
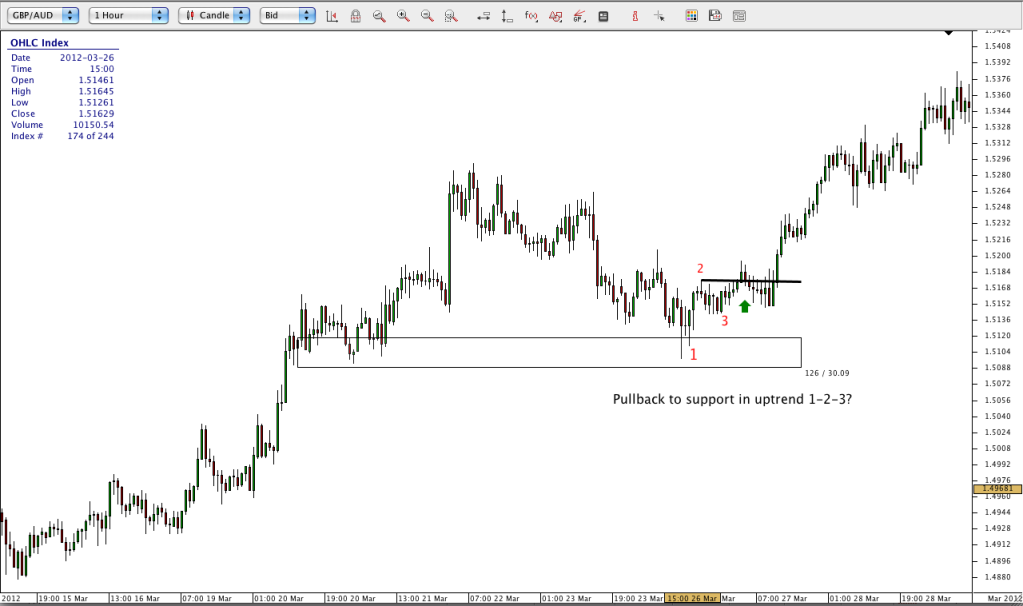
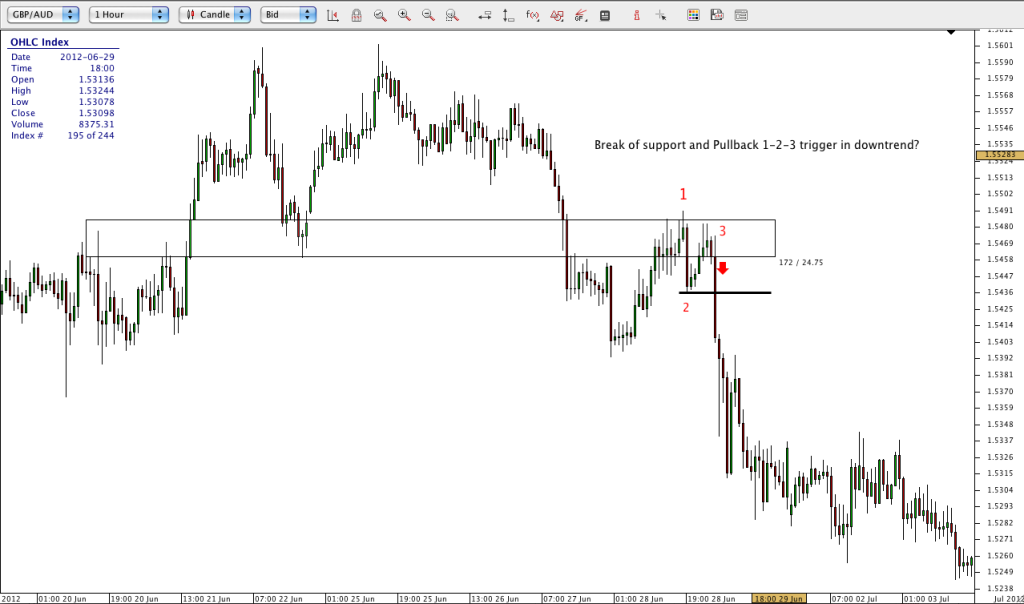
I recall Tess and Kevan Reynolds favoring 1-2-3 continuation and reversal triggers at zones of interest. I am a bit confused as to the difference between the two triggers. Can someone with experience please clarify the differences between the two and how they are played?
I have included two charts below as examples. In both instances they are with the main 4 hour trends. The first is pullback to a support level in an uptrend and the second is a break of support and then a pullback within a downtrend. Both examples are 1 hour time frame. Are these continuation or reversal, and are these examples a good representation of how they are played?
Thanks
Steve
You actually answered your own question in the first sentance of the last paragraph Steve.
They are great examples of a 1-2-3 continuation trading away from a key level.
In essence a higher low or a lower high confirmation (which is basically all a 1-2-3 is) in that particular scenario is tipping you the nod that the potential for continuation is high & the participation on that move is positive.
If it isn’t then you’ll receive an early alarm call at point 2, where the price action either begins to stall out or fails to kick on.
They all favor that trigger whenever it sets up at significant, high probability contact zones Steve.
It still remains one of their most consistently successful triggers, especially when executing off the big s&r turns.
The key filter when executing it is where on the technical chart it sets up.
To repeat their usual primers:
big figures (round numbers)
the monthly/weekly/daily high low levels
& of course the prior s&r barriers that either held or turned the price.
You’ll know from reading their stuff that those zones are where most of the important action takes place from the key players for the varying reasons they’ve covered in here.
AltTab correctly confirmed your view of the continuation trigger.
The reversal play is just that, a trigger that confirms a potential switch or flip of a strong directional move at a previously important technical zone.
They will only take these on at big, previously reactive s&r zones. Those are the higher probability area’s that ratchet up their odds & offer the lower risk bets.
You highlighted examples of a continuation 1-2-3, here’s a classic example of a reversal that would interest them.
Big, trendy 8 handle move up over a 5 month period right into a very visible prior area of solid support that encompasses one of their favorite technical barriers (a round number: 1.30)

The zone will already be on the radar way before price arrives & it will be visible all the way down through the various timeframes.
When it gets there & reacts, you’re looking for confirmation that the zone either attracts further bids & pushes through or gets offered & smartly rejected.
The 1-2-3 offers you one option of playing the pullback rejection to a potential reversal at a key prior area of strong support (now looking to act as resistance). And you can take that set up from any secondary timeframe of your choice because it’s the level or zone that that is influencing the decision, not the timeframe or any other minor detail.