you would think that I should be looking for longs with it bouncing off that level but I actuall went short at 4316 down to around 4250 and then shorted again when it went back up to 4316 and just closed out. Been looking for shorts mainly because that’s the bigger direction on daily, weekly and monthly but with this reapeated support I may rethink it a bit.
Sometimes I almost think I’m beginning to know what I’m doing
Isn’t it just!
They said repeatedly throughout their original threads, that if all you did was to focus on those highlighted levels & zones you wouldn’t need to look anywhere else for value opportunities.
They weren’t wrong huh.
I got the nod to leave my favorite pairs alone for now & zone into aud/jpy as it flirted with a big daily (76.30-80) channel.
Less stress & better value to risk ratio.
Those 3 pairs are way too much like hard work at current levels & not really offering up any real value at all this week.
They need to stretch out a little & catch a backwind for a day or two to tempt me back in.
Danny, (on the bid) works on a contract deal, Carly (carlybonner) & myself are freelancers.
When we’re in UK we work a desk out of Tess & Co’s offices.
When we’re not, we dial in via a remote link & get allocated an access code to lock into whichever platform & funding base they want us to work.
I also trade private funding streams for Tess & Jocelyn’s brother & one of their parents when required.
Danny specializes in short-range strategies covering (jobbing) positions on larger sized deals, or feeding tiered size into a move to establish & work an averaged position.
Carly & myself will simply work whatever deal is required, across a varied strategy ladder.
But it’s not an exclusive deal.
We can end up trading across several accounts during a typical day or week, depending on how busy they are, level & pair dependant & what they’re looking to achieve.
There’s a varied diet of work that goes on behind the scenes.
Meetings with clients via face-to-face, webinars & conference calls etc to discuss options & objectives.
Strategy deployment structures to construct, manage & expedite.
Potential funding avenues to check out
Meet ups with broker reps & business relationships to nurture & establish etc.
They’ve also got a private forum that we all contribute material to that includes a live trading room which majors on set ups, triggers & on the spot research analysis for the more active clients.
There’s more going on than just sitting in front of a screen pod all day.
I don’t know if anyone is around, but I really seem to struggle with getting sensible S/R lines on my 4H chart. It seems that I can see past S/R at just about every RN and many 50 levels which is just not helpful! I have tried again today, and have found it easier looking at a bar chart and have come up with the following.
It still seems fairly cluttered! Any thoughts or suggestions would be much appreciated.
Hey Waytogo, I do not personally look at the round numbers all that much. I tend to draw my lines around: Previous month, Previous 4weeks high/low, and the current weeks open. My current trading style also requires the previous 4hr candle high/low/open/close. All of which I have plotted automatically with the attached mt4 indicator.
In addition I will track back through the charts and find significant points of S/R zones based on weekly and monthly charts. Finally, if I see a period of consolidation on the 4hr chart, I will draw lines around it.
Hi Liz,
Firstly, do you really need all those lines on your chart at one time?
Think about what it is you’re looking to achieve from your analysis of the support & resistance zones when price eventually arrives at one of your identified zones.
What are you going to look for in order to instigate a bet & how is the zone going to affect & influence your decision making process.
If price is [I]trending[/I] up or down toward your next zone of interest, what is going to influence you to either place a continuation bet, or consider placing a potential reversal bet.
If price is [I]ranging[/I] back & forth between 2 of your identified zones, what are you going to need to see happen in order for you to take action & execute either a long or a short bet?
What I’m suggesting is that you use the immediate upper & lower support/resistance zones as guide posts or triggers to get your strategy or trade plan into action.
Your decision will likely be influenced by whatever price cycle the chart is currently rotating through (clearly defined trending bias, or clearly defined ranging bias).
Other considerations might be:
What occurred the last time price moved away from your identified support/resistance zone?
How aggressively did it move & what (if known) influenced the move?
The behavior of the price action as it reacted to a previous level will generally reveal one or two clues to the appetite of the demand or supply activity, especially the construction of the bars or candles, which of course are simply representations of trader psychology.
If the move away from a level was rapid & aggressive, that would trump any other level or zone of interest next time price revisited it.
A lot depends on your trade plan, objectives & risk attitude.
Take a look to the left of your Cable 4 hour chart now & look see what occurred during 8-12 May.
Quite a visible rejection of this 1.4975-1.5040 zone back then huh?
That zone should definitely (have been) be marked up on your chart, as should the next zone around 1.5360-90.
Those would be the only upper tier levels to interest me on this current climb.
It’s already reacted to this zone during this weeks play as it rejected 1.4870-1.4920. Again, look left to 13 May to see what I’m referring to.
Price approached that prior supply zone on Monday & got swiftly repelled before attracting further demand via the pullback.
Same behavior pattern playing out again today up here at the 4975-5000 fair value zone, also a clear prior level of supply on this pair.
My own personal lower demand interest zones from the current price would be marked up at:
1.4640-80 & the 1.45 figure.
If you look back & run a horizontal channel across those levels you should see why!
Marking SR levels does take some time to get right. First of all, you will do yourself a great favor if you only mark the nearest levels at a time. You won’t need some hazy level hundreds of pips away anyway, so why not just mark lets say nearest two up and down.
An other useful guide is to focus mainly on the most recent activity in the area you are mapping for SR levels.
If you consider these two aspects during the planning process you’ll rarely go wrong I can promise you that.
Jos covers that very point a few pages back, & if you click the link you’ll be able to peruse the post in detail with chart examples.
Keeping your chart reference clean & concise with merely a couple of close quarter upside & downside points of interest will help to focus you in on the priority zones that are likely reactionary levels next time round.
If price fails to honor or react as planned, then drill out to the next potential reaction zones & set up your triggers accordingly.
I’m reading a great deal of material at the moment and getting conflicting opinions about support and resistance zones and whether the more times a zone is visited/tested, whether the zone becomes weaker or stronger i.e. more or less likely to break on a subsequent test.
Whats the general opinion of guys and gals on this thread?
There’s no telling wether a zone will break or not. The only thing you can be certain of is that when it does you’ll be there with a gameplan to execute.
quitter is right, you’re not going to know if a zone holds up or not until the next time it’s tested & the participants begin working the orders back & forth around a particular s&r zone.
you could try paying a little more attention to the types of behavior that a zone attracts when the price action begins keying off it.
try get a gauge on how passive or aggressive a zone is when the price moves away from it & then revisits the area, as jj mentioned in his prior post.
if a zone repelled the price action aggressively, or didn’t spend very much time at that level, I’d be paying it a whole lot of attention next time around. There’s usually a very good reason why a level gets punted like that, & it will certainly flag up attention & maybe hold a clue or two as to the potential on any subsequent revisits.
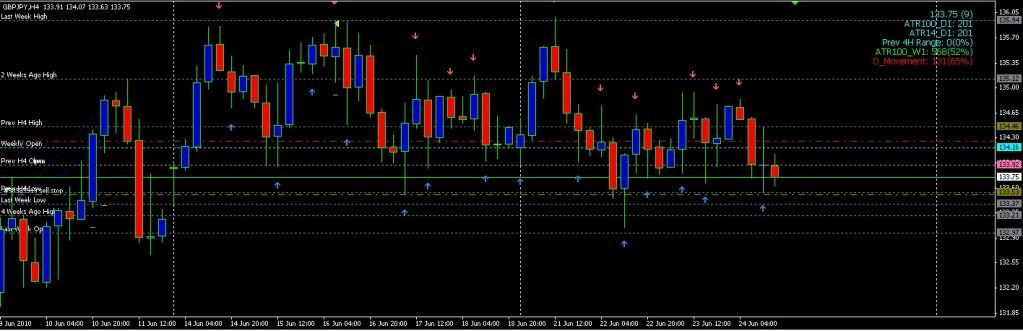
Tess & Sean flagged up one such zone earlier this month at the 113.25 pitch on the eurjpy.
look at how fast & hard the price moved away from zone.
that’s a typical flag or alarm bell to begin marking it out & waiting to see if price gets batted back up there again on a counter punch move.
that counter move comes along again mid month (16 & 17 June), when supply enters the market right around that previous resistance level.
if you were chasing a long bet up the ladder into that prior zone, you might want to be looking to cash out, or at least reduce your exposure as price begins moving into that supply zone…either that, or prepare to place a short bet on any stalling or exhaustion behavior?
and just to confirm the continued supply up there, it gets repelled yet again earlier this week (monday) where those rejection bars clearly magnify the reluctance of players to push through this stiff supply ceiling.
that’s the type of behavior you’d do well to begin identifying as & when price visits & revisits these aggressive reaction s&r zones.
there’s plenty of examples on here & the other 2 threads highlighting these repetitive behavior patterns.
Thanks so much for the replies, everyone. My 4H chart is looking a whole lot better now it’s got fewer lines on it. I thought it was probably cluttered - just didn’t know by how much!
Liz
The structure is ok:
Price is displaying a strong bias (short)
Breaks key level(s)
Shallow pullback etc, so it has potential from that standpoint….but
Let me ask you a couple questions.
Is this a potential intra-day bet?
If so, where’s your follow-through downside potential?
Do you factor in the average days range coverage when preparing typical short-range excursions to the market as part of any risk to value template?
If you do, how much of the average range has already been covered from the days opening ticks to the pullback bounce earlier this morning at 1.3420?
and would that be an influencing factor in your positions forward profit potential?
Those were certainly suggestions that were put to Carll & a couple other folks who were looking to trade this type of intra-day play, sure.
They’re handy guides to refer to at the beginning of the european shift & when prices are extending aggressively into the trading day.
If you get a feel for a pairs typical behavior patterns when it approaches these kinds of technical markers, especially when probing fresh ground like new or long time highs & lows, they can quite often reveal subtle clues & signals to help identify possible continuation or reversal (exhaustion) behavior.
Just thought I’d throw it into the pot & see if it struck a chord is all.
If it makes sense explore it a little & see if it adds benefit – if it doesn’t, then toss it.
Well, for one thing it doesn’t always play ball.
There will be times when ranges will extend way above, or contract well below their typical average session, & that can be for any number of reasons.
The thing is though, you’re looking to play “typical scenarios” & although you’ll experience unique or irregular periods where they might skew the averages for a while, it dosn’t generally kick them out of whack for too long.
I’m afraid I don’t buy into this [I]controlling markets[/I] nonsense.
No single or even combined entity has sufficient clout to control anything, let alone a prolonged hold on a market as deep as this one.
You simply got too many differing agenda’s playing out every day/week to hang that hat on any one or group of players, well certainly with the strength in numbers of the market flow these days anyhow.
I don’t much care how or why it plays out so consistently, only that it does.
It’s sure stood the test of time & more than justified itself as a reliable reference inclusion.
There isn’t much worth paying any serious attention to out there, but if I was punting an intraday gig on a regular basis, I’d definitely have that item right up there on my score sheet.
I agree with Carly, you’re certainly not struggling with the concept.
The toughest part of any discretionary gig is biding your time, waiting for the optimum location/higher value level from which to engage.
But if you stick to the types of zones you’re describing in your posts, particularly when there’s a clear bias playing out, you’ll begin stacking the value (& risk) on your side more times than not.
We don’t advocate a specific timeframe at all Matt.
Everything pivots around the area or zone.
That’s the most important thing. The s&r levels can be identified on any timeframe & can then be matched to your own personal trade objectives.
Carll experimented with various timeframes & eventually adopted the 5-minute chart as the template for this set up & trigger to sit comfortably alongside his objectives.
With a little encouragement from us, he restructured his outlook so that he was playing his odds & executing his model based on quality analysis rather than coming at it from a trade quantity perspective.
The gbp/usd, eur/jpy & gbp/jpy pairs afford him the required criteria to offer a sufficient number of decent quality trade possibilities across a typical trading week & at least 50% of the opportunities fire off during the height of the London shift.
We advise (as we always have) folks play the percentage game.
Identify areas that held prior significance & mark them out accordingly
Ensure the risk justifies the potential
Wait for the price action to trigger you in.
If the range numbers make the trade a viable proposition, & you’re not paying too much for the privilege of taking the trade on, then you’re good to go, regardless of the time of day.
London is responsible for the highest spot volume uptake for sure. But it won’t always dictate the execution process.
It depends on the price action.
If it’s keying in off a previously identified area of significance when London comes online, then cool. Technical levels don’t recognize clock times.
The ideal scenario is for the trigger to fire off during the London morning action, but as long as you can justify the risk in relation to the potential returns, then you’re good to go whenever that occurs.
You can be if the model you’re using is specifically structured around the early London flows.
I wish it was so straightforward to apportion specific tasks across a typical trading day (she lets forth a big envious sigh!!)
Unfortunately, it doesn’t quite work that way.
9:15 GMT
(IGM)[EUR/USD] jumps and trips the 1.2250 stops after the market receives demand for the 3-month ECB tender. The amount was…
[EUR/USD] jumps and trips the 1.2250 stops after the market receives demand for the 3-month ECB tender. The amount was just Eur 131.9bln vs the FX markets cited doom-mongering mark of Eur 300bln, which had been banded about before. High so far is 1.2268. More stops tipped through 1.2275/80, but we expect sellers to come back at 1.2300/20.
Do you get any news via your trading platform? I get IGM news via GFT