In this technical blog, we will look at the past performance of 4 hour Elliott Wave Charts of Tesla stock ticker symbol: $TSLA. In which, the rally from 05 March 2021 low unfolded as an impulse structure with an extended wave three and showed a higher high sequence. Therefore, we knew that the structure in Tesla is incomplete to the upside & should see more upside. So, we advised members not to sell the stock & buy the dips in 3, 7, or 11 swings at the blue box areas. We will explain the structure & forecast below:
Tesla 4 Hour Elliott Wave Chart
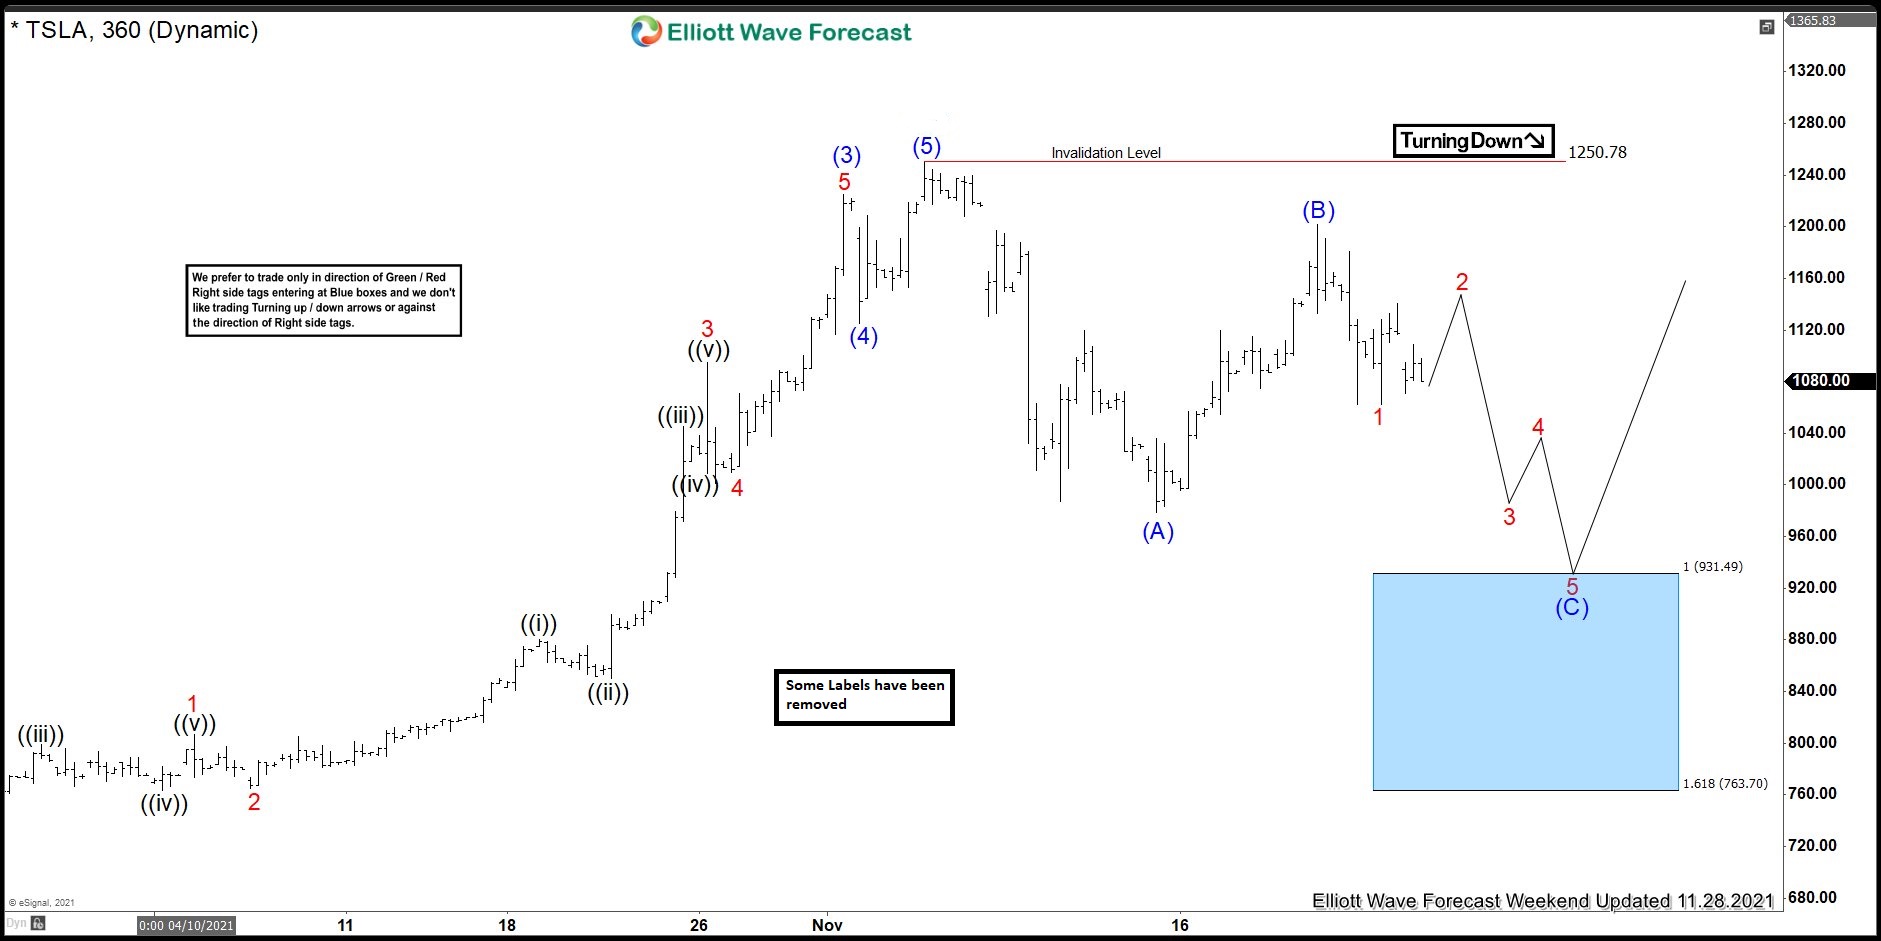
Here’s 4hr Elliott wave Chart from the 11/28/2021 Weekend update. In which, the rally to $1250.78 high ended 5 waves from 5/19/2021 low & made a pullback. The internals of that pullback unfolded as Elliott wave zigzag structure where wave (A) ended in 5 swings at $978.60 low. Then a bounce to $1201.95 high ended wave (B) & started the next leg lower in wave © towards $931.49- $763.70 blue box area. From there, buyers were expected to appear looking for new highs ideally or for a 3 wave bounce minimum.
Tesla 4 Hour Elliott Wave Chart
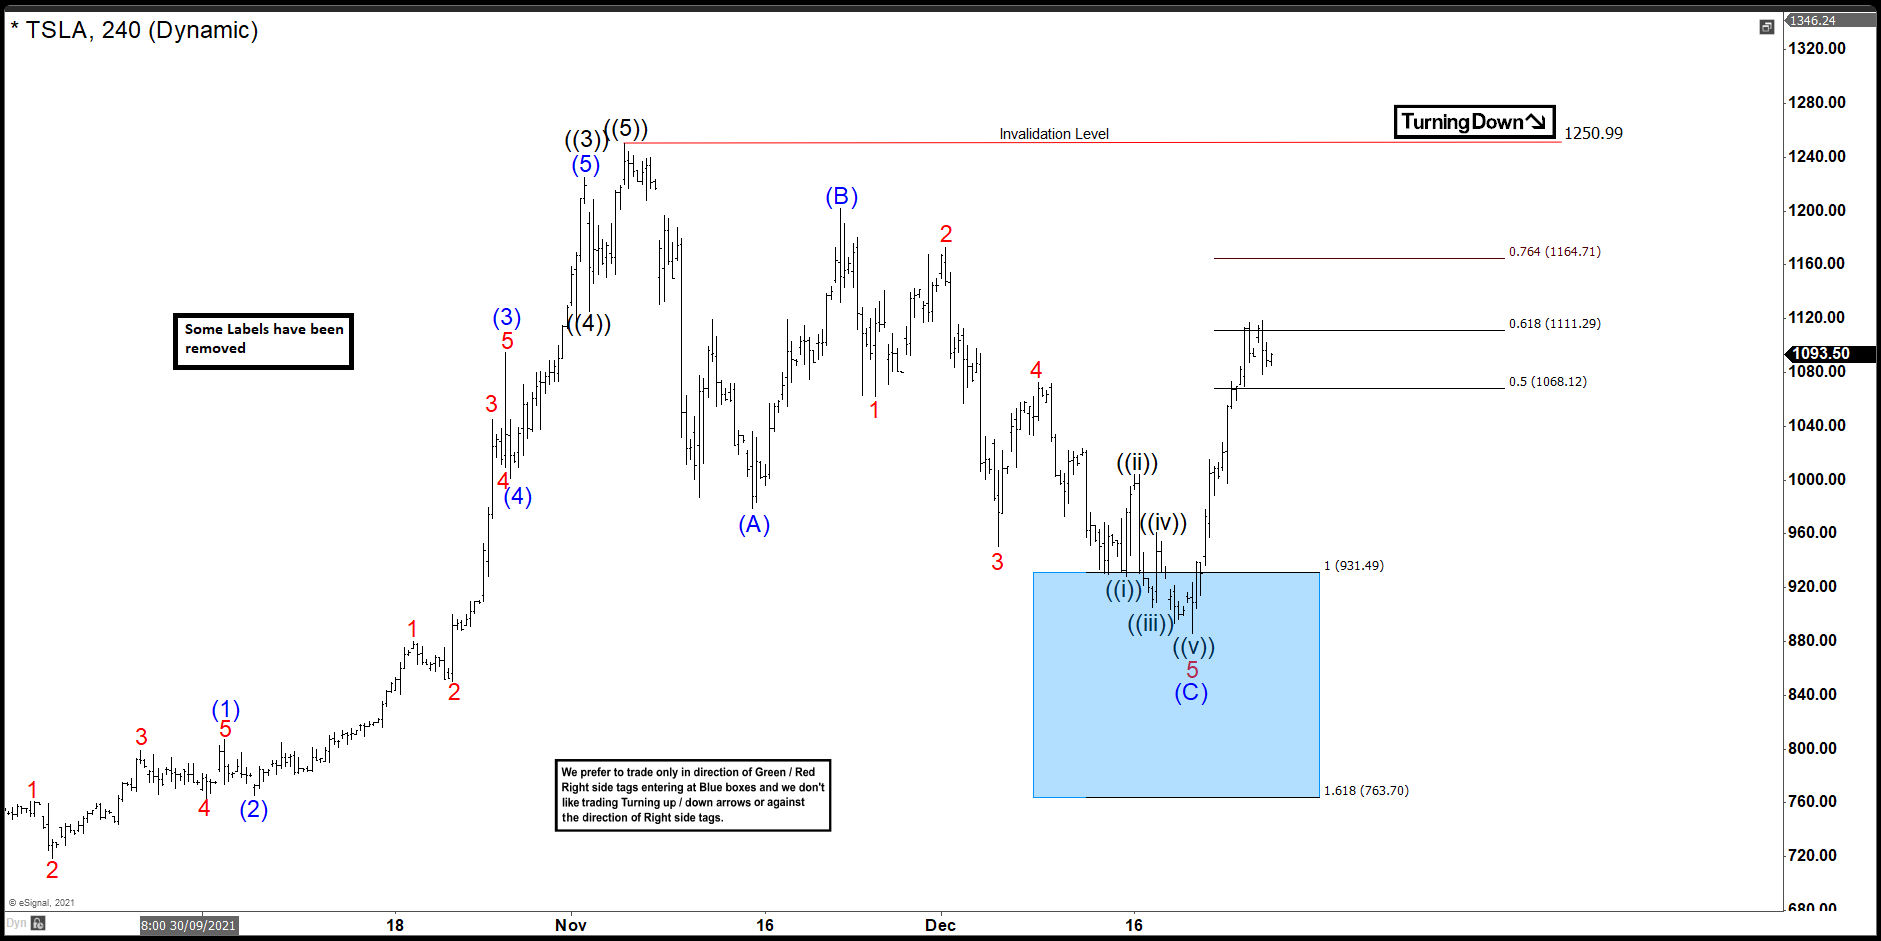
This is the latest 4hr Elliott wave Chart, in which the stock is showing a reaction higher taking place from the blue box area at $931.49- $763.70. Right after ending the zigzag correction within the blue box area. Allowed members to create a risk-free position with the minimum reaction higher towards 50%- 76.4% Fibonacci retracement from the peak. However, a break above $1250.99 high is still needed to confirm the next extension higher & avoid double correction lower.
Source: Tesla Blue Box Area Provided The Minimum Reaction Higher