In this technical blog, we are going to take a look at the past performance of 1 hour Elliott Wave Charts of Tesla Motors ticker symbol: $TSLA. In which, the rally from 18 March 2020 low ($350.51) showed an impulse structure with an extended wave (3) higher suggested that another leg of strength in wave (5) should take place to complete the 5 waves impulse sequence. Therefore, we advised members not to sell the instrument & trade the no enemy areas ( blue boxes) as per Elliott wave hedging remained the preferred path looking for 3 wave reaction higher at least. We will explain the structure & forecast below:
Tesla 1 Hour Elliott Wave Chart
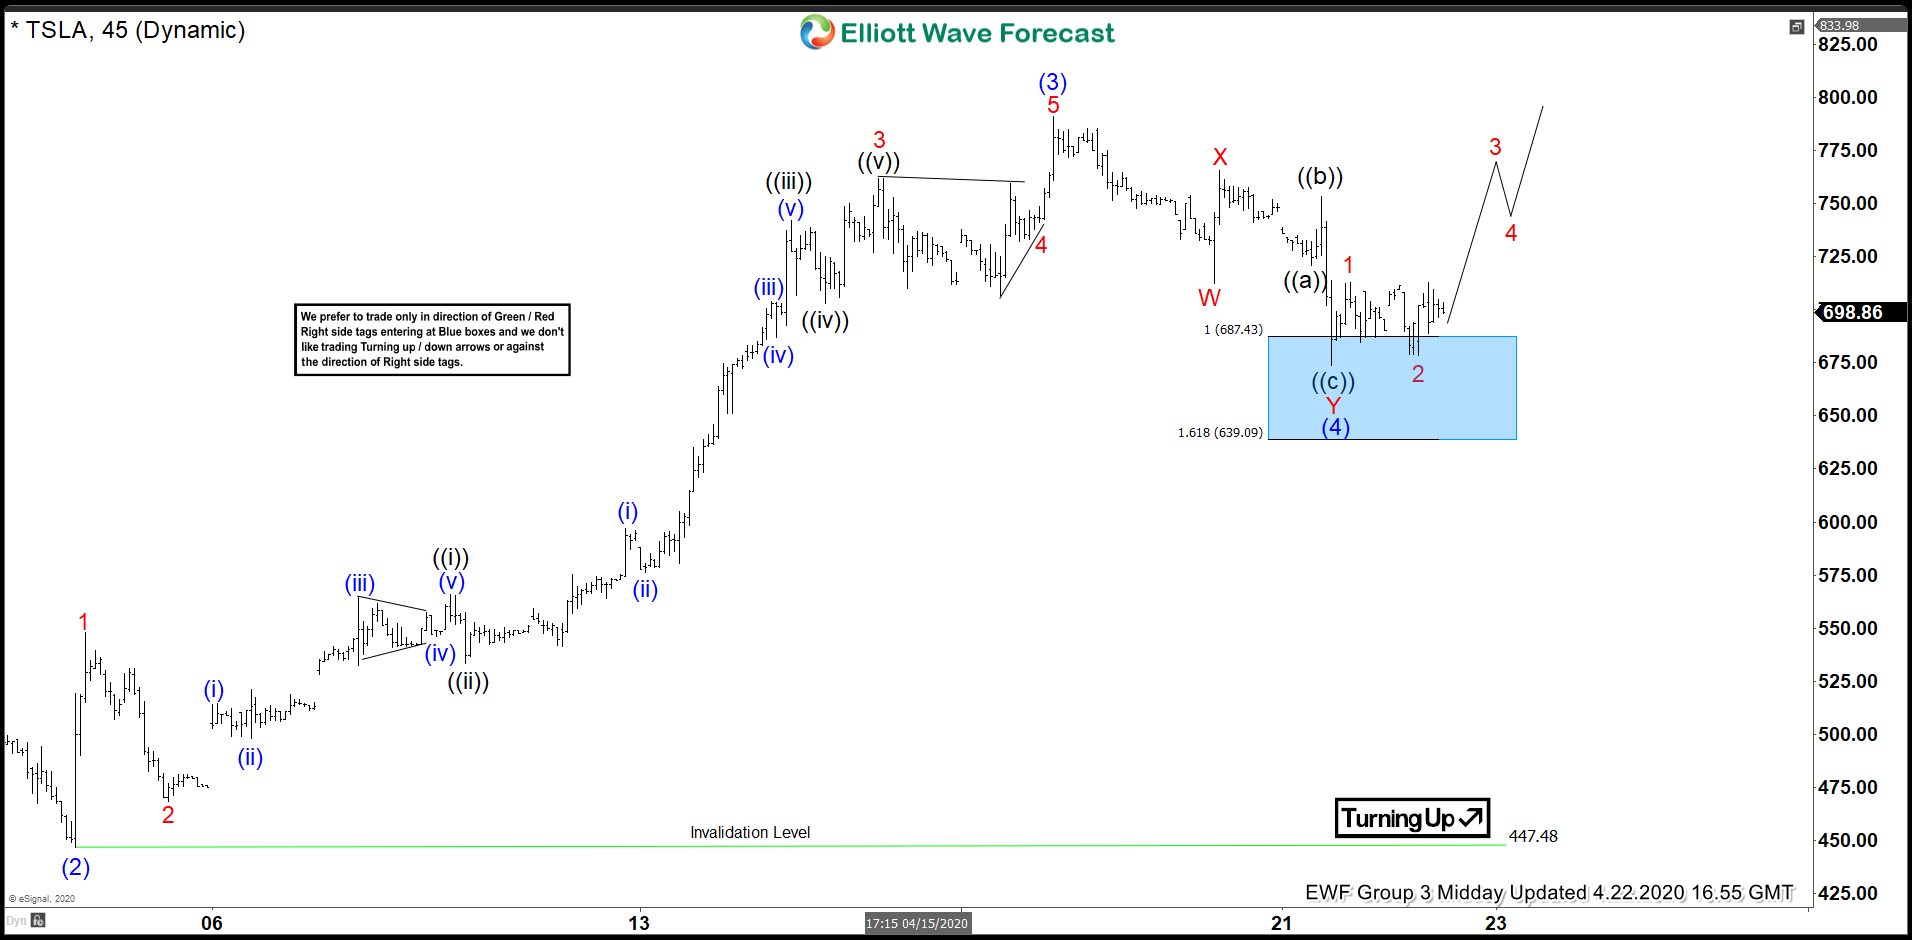
Tesla 1 hour Elliott Wave Chart from 4/22/2020 Midday update. In which, the rally to $791 high ended wave (3) in lesser degree 5 wave structure. Down from there, the stock made a 3 waves pullback within wave (4). The internals of that pullback unfolded as a double three structure where wave W ended at $712.21 low. Wave X bounce ended at $765.57 high and wave C managed to reach the $687.43-$639.09 blue box area. From where the buyers were expected to appear in the stock looking for another 5 waves rally. Or to do a 3 wave reaction higher at least.
Tesla 1 Hour Elliott Wave Chart
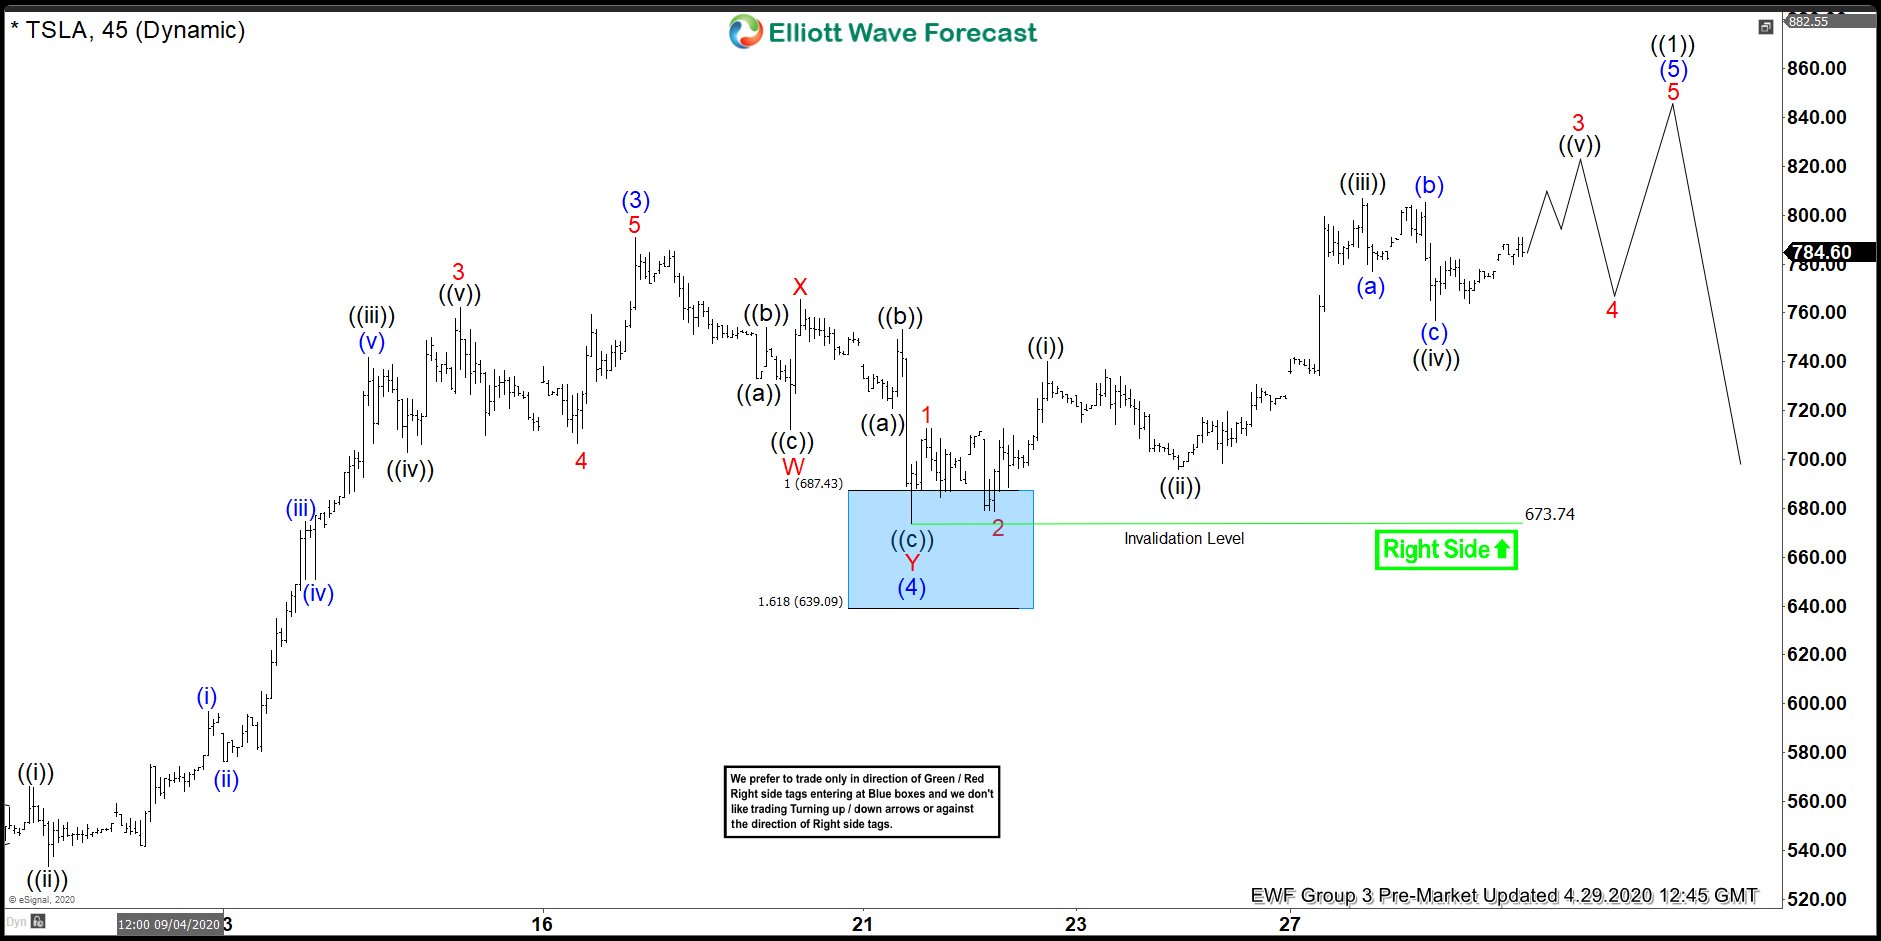
Here’s 1 Hour Elliott Wave Chart from 4/29/2020 Pre-Market update. In which the stock is showing reaction higher taking place from the blue box area. Allowed members to create a risk-free position shortly after taking a long position at $687.43-$639.09 blue box area.