In this technical blog, we are going to take a look at the past performance of 1 hour Elliott Wave Charts of Tesla ticker symbol: $TSLA, which we presented to members at elliottwave-forecast. In which, the rally from 30 October 2020 low unfolded as an impulse structure. Thus suggested that it’s a continuation pattern. And as per Elliott wave theory after a 3 waves pullback, it should do another extension higher in 5 waves impulse structure at least. Therefore, we advised members not to sell the Tesla & trade the no enemy areas ( blue boxes) as per Elliott wave hedging remained the preferred path looking for 3 wave reaction higher at least. We will explain the structure & forecast below:
Tesla 1 Hour Elliott Wave Chart From 11/09/2020

Here’s 1 hour Elliott Wave Chart from the 11/09/2020 Midday update. In which the pullback in wave ((2)) unfolded as a double three structure where wave (W) ended at $407.38 low. Wave (X) bounce ended at $430.50 high and wave (Y) ended at $379.14 thus completed the pullback. Up from there, the Tesla rallied higher in an impulse sequence & ended wave A at $452.50 high. Down from there, the stock made a short-term pullback against the $379.14 low & was expected to provide us buying opportunity in 3 or 7 swings.
Tesla 1 Hour Elliott Wave Chart From 11/10/2020
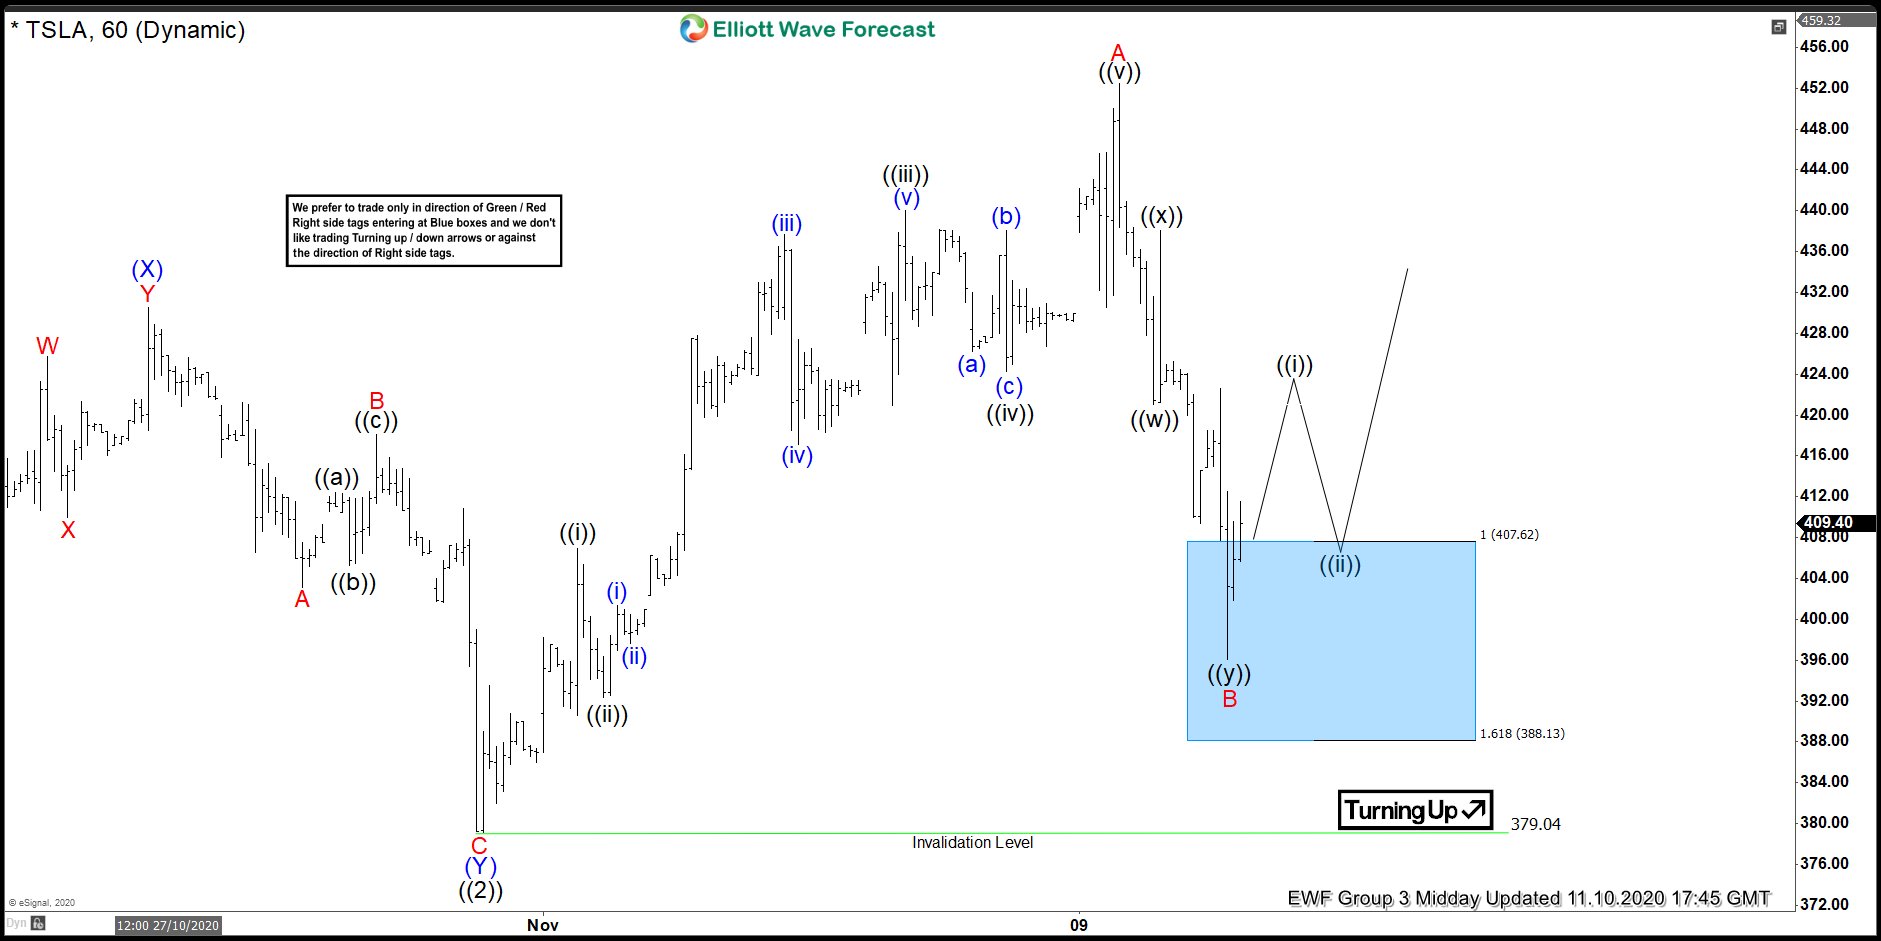
Here’s 1 Hour Elliott Wave Chart of Tesla from 11/10/2020 Midday update. In which the stock made a wave B pullback as a double three structure & managed to reach the blue box area at $407.62- $388.13 100%-161.8% Fibonacci extension area of ((w))-((x)). Therefore, offered members a buying opportunity looking for new highs ideally or for a 3 wave bounce at least.
Tesla 1 Hour Elliott Wave Chart From 11/17/2020
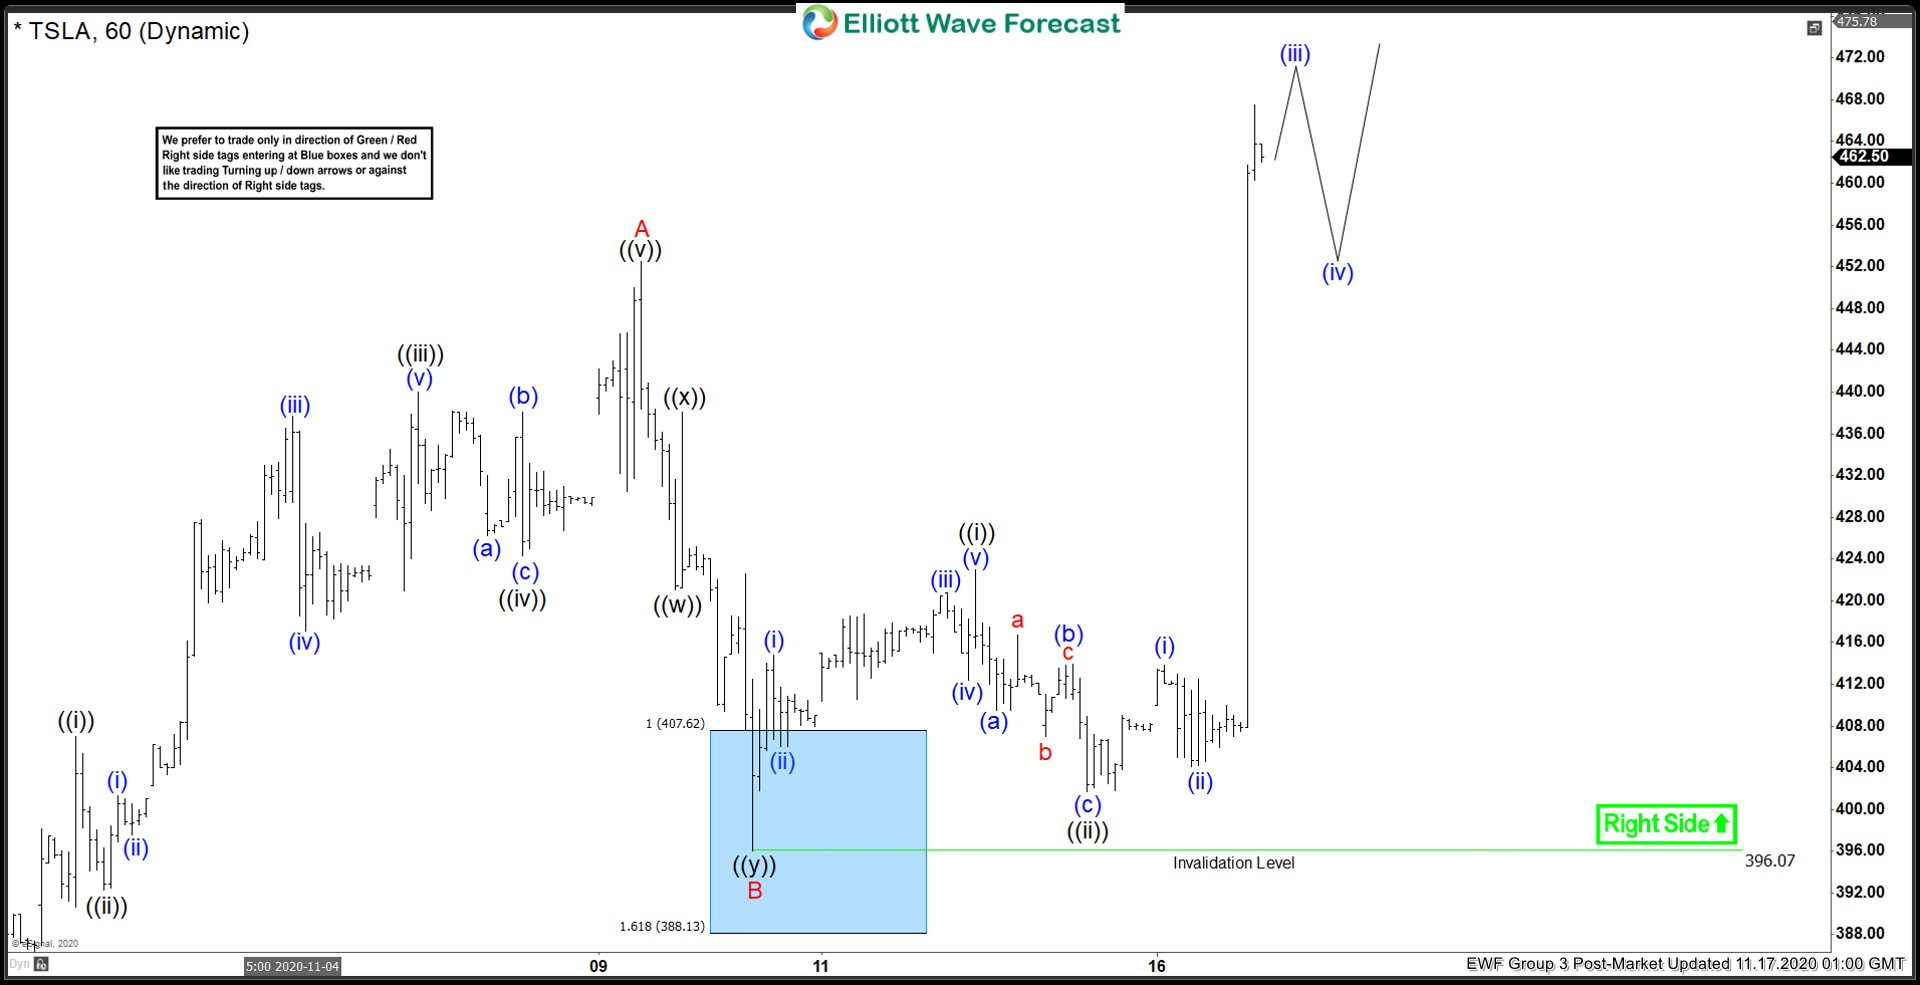
Above is the 1 Hour Elliott Wave Chart from 11/17/2020 Post-Market update. Showing a strong reaction higher taking place from the blue box area. Allowed members to create a risk-free position shortly after taking the longs at $407.62- $388.13 blue box area as per Elliott wave hedging.