Hello Traders. In today’s article, we will look at the past performance of 4 Hour Elliott Wave chart of Tesla, Inc. ($TSLA) The rally from 1.06.2023 low unfolded as a 5 wave impulse and ended on 2.16.2023 at $217.55. A 7 swing corrective pullback (WXY) took place since the peak.
$TSLA 4H Elliott Wave Chart 4.30.2023:
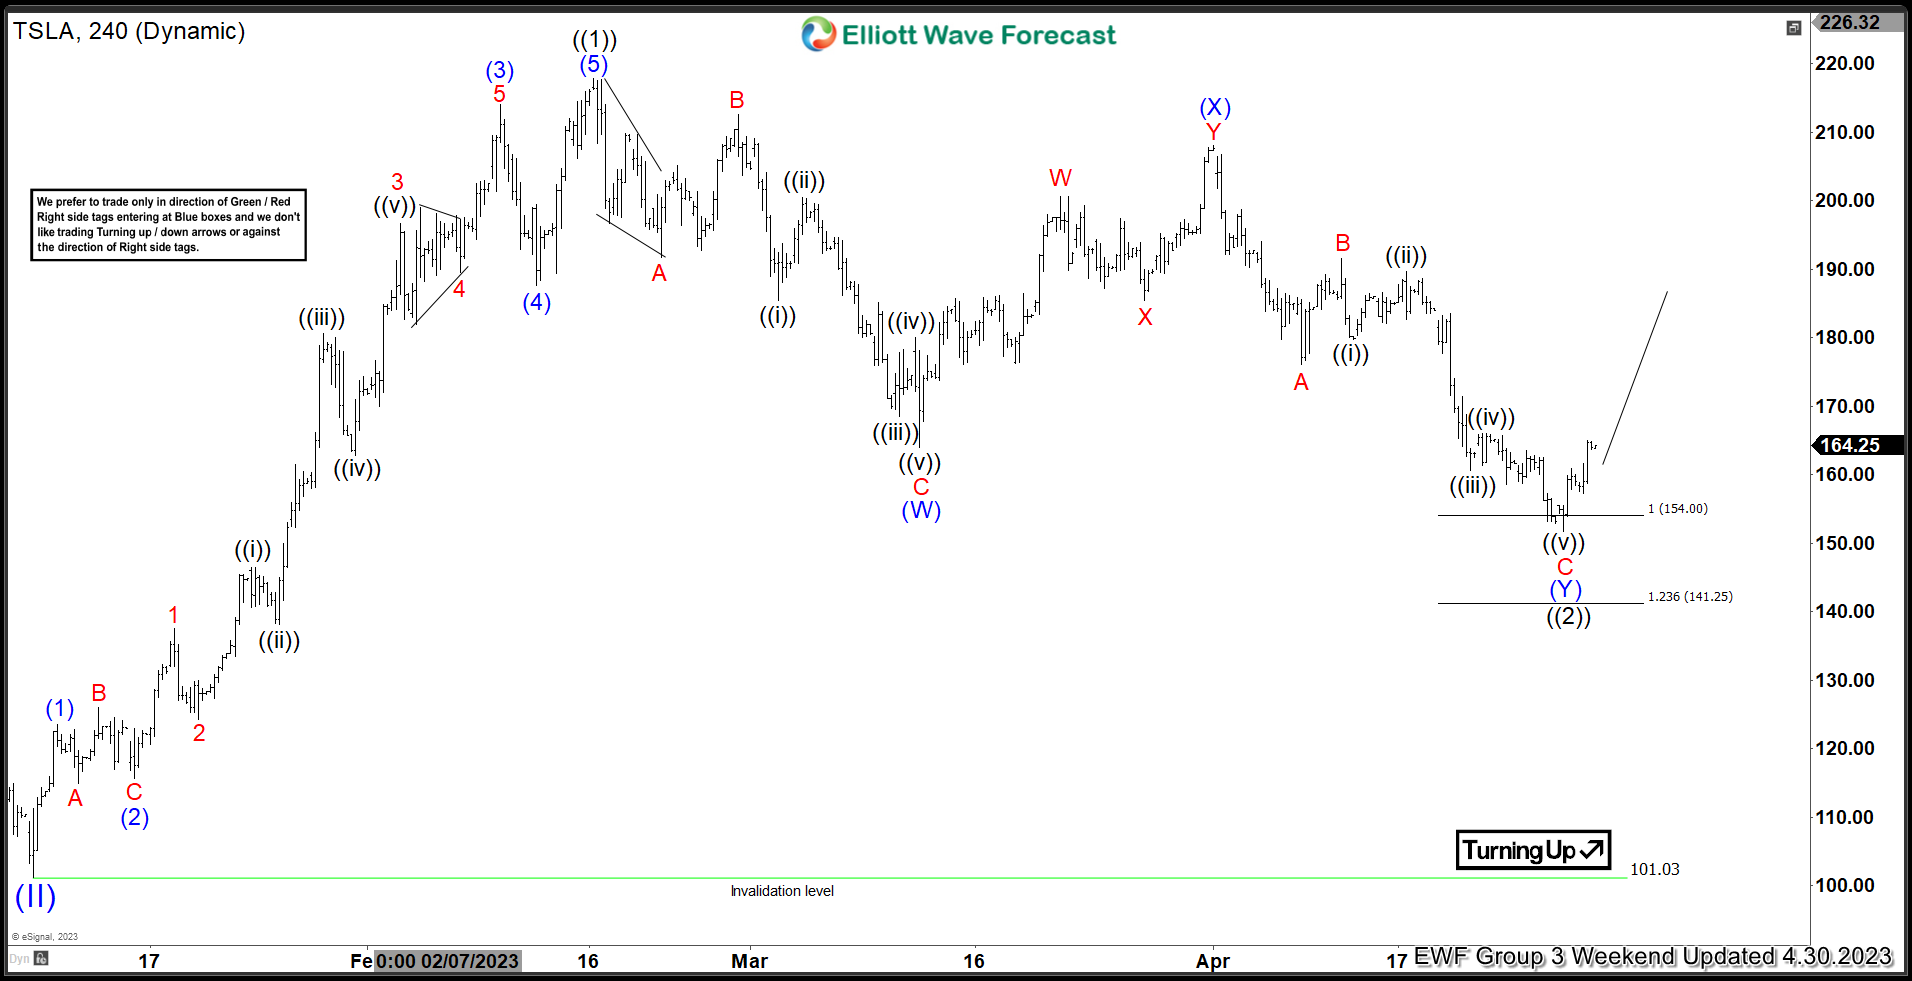 Here is the 4H Elliott Wave count from 4.30.2023. The rally from 1.06.2023 unfolded in a 5 wave impulse which signaled a bullish trend. We were calling for the pullback to find buyers in 7 swings at $154.00 - 141.25 where we liked to enter as buyers.
$TSLA 4H Elliott Wave Chart Latest View:
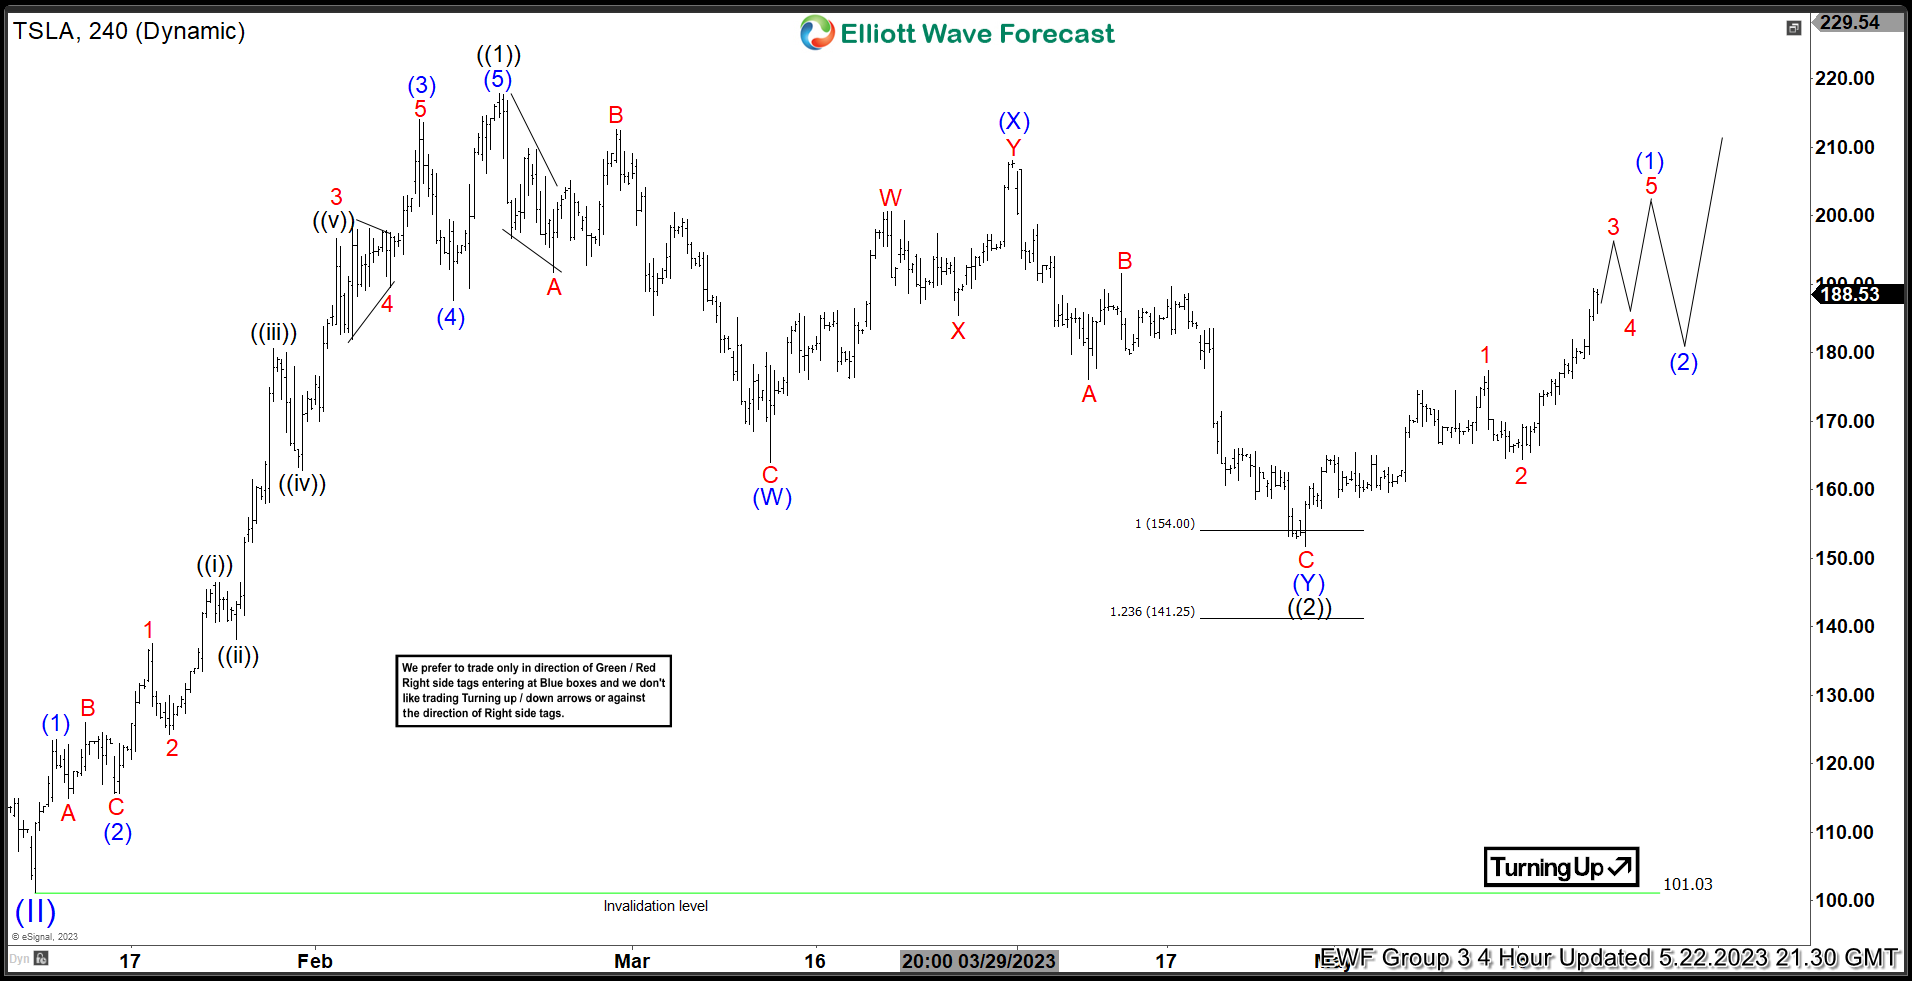
Here is the latest 4H update showing the move taking place as expected. The stock has reacted higher ending the cycle from 2.16.2023 peak. It reached the 50% back from (X) allowing any longs to get risk free with a higher target towards $270 - 340