I will use this thread to try an outline how I approach trading the currency markets.
After many years of trading, this is what works for me and is a collection of different “bits” from a few different methods that help me answer the key trading questions that face each trader.
If one trader finds something in this method that helps them with their own trading then that is a good thing as I’ve been helped many times along the way by others and their own individual methods.
I have nothing against any type of indicator. You’ll hear no rants from me.
I just happen to like, and trust, these very simple linear weighted moving averages that are applied to the daily timeframe but can easily be viewed on the 4 hourly chart.
They are:
LWMA 10, set to the open price, shifted 1 period ahead.
LWMA 8, set to the close price. No shift.
These are like my safety blanket. They help remind me how price is flowing across the chart when I’m tired and they give me the direction that I have to trade.
Simple Rule:
ONLY BUY when 8 is ABOVE 10.
ONLY SELL when 8 is BELOW 10.
When price is flowing nicely either up or down, this oversimplified rule can give you the most lovely stress free trades.
That’s what I constantly strive for in my trading and is why I only trade a 4 hour chart.
You can call numbers like, “1.55000”, whatever you wish, doesn’t bother me, I just like to have these numbers faintly marked on my chart with dashed lines, as these “zones” of price on a chart often see some nice price movements when the time is right.
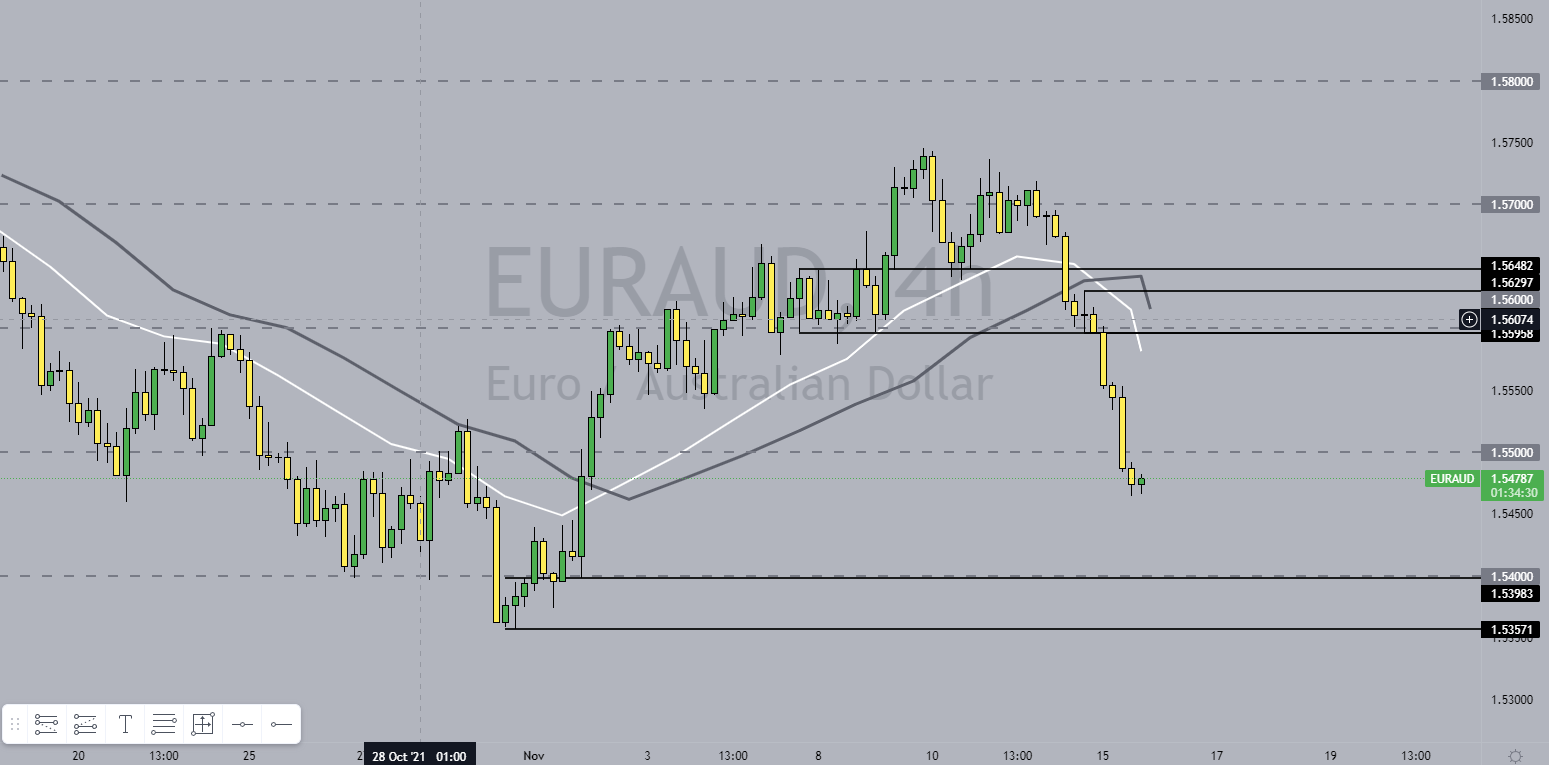
Here is a trade from last week. The week before there were no trades on this pair as it was a changeover week where the moving averages swapped over from a strong directional move.
The 8 LWMA is ABOVE the 10 LWMA = BUY ONLY
There is a full body H4 Candle that has Opened and Closed ABOVE the current week’s Weekly Value Area.
Now I can look for BUY TRADES on a return to the Weekly Value Area
ENTRY: There is a H4 BUY (GREEN) CANDLE that has closed ABOVE the WEEKLY VALUE HIGH.
[The low of this candle is lower than the previous candle’s low which is a strong sign to buy at the close of the candle.
STOP: Below the H4 Candle Low. You must expect to be stopped out on EVERY trade. That way you will remember to manage your risk because you will most likely lose this trade.
TARGETS:
The 1st Target was the 1.57000 number. Stop was trailed to the low of the H4 candle and just above breakeven.
[When price has moved 20 or 30 pips in your favor and you are only risking 30 pips for example it is important for your account and your psychology to bank some profits.]
The 2nd Target was the OPEN of the HIGHEST H4 GREEN CANDLE.
Thoughts on PARTIAL PROFIT TAKING:
When you bank profit and how much you bank is up to you and is your decision alone.
I’m trading to make 3% to 5% per month as that is my job. My job is to make that kind of consistent return.
Others will have different expectations and styles and personalities.
Always important to use this chart throughout the trading week as a baseline for all USD pairs.
If there is a strong H4 buy candle on this chart at this week’s value area then it is best to be checking XXXUSD pairs for Sells and USDXXX for buys if they are in the correct place.
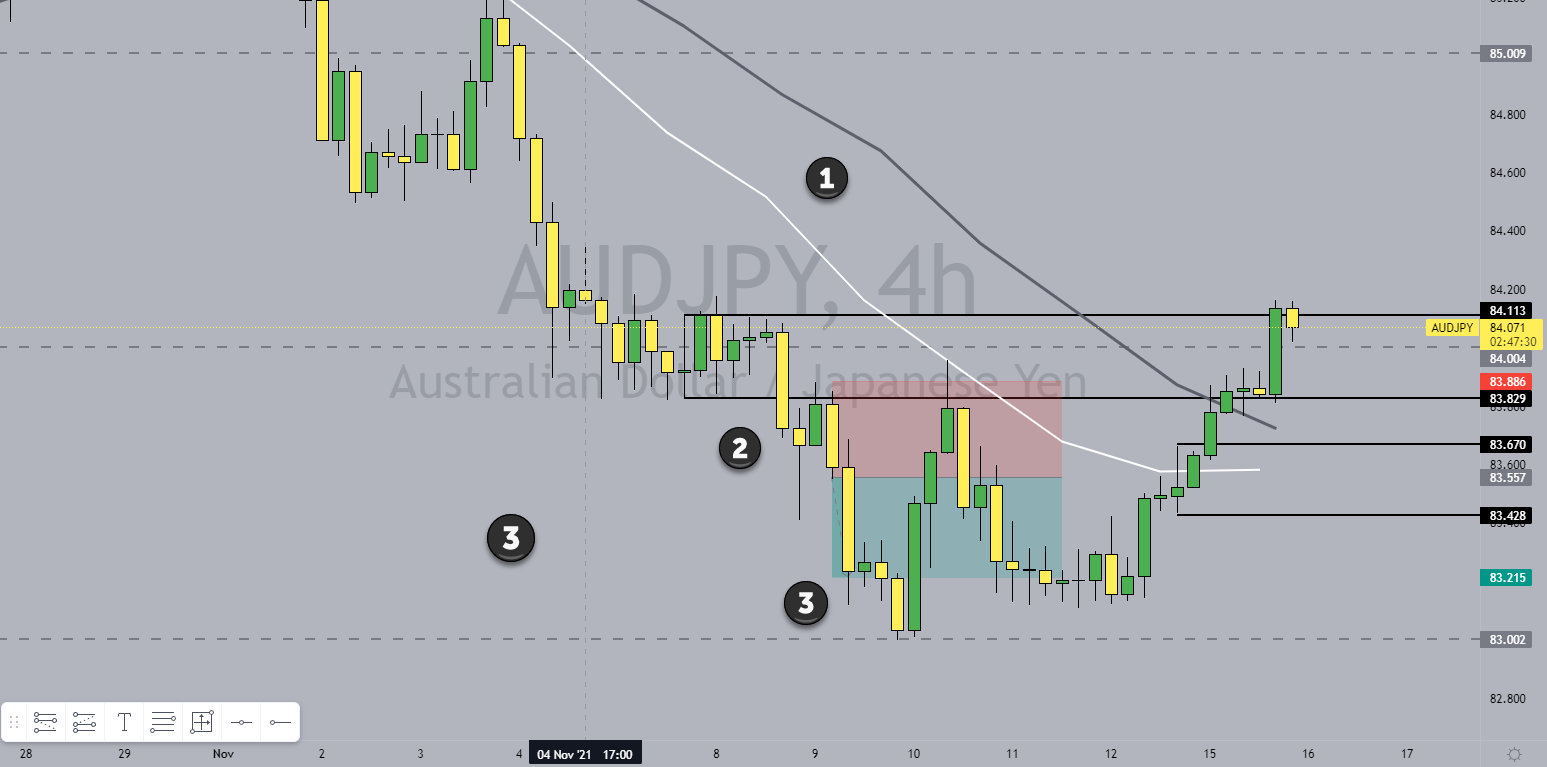
There is a full body H4 Candle (Open & Close) BELOW the current week’s Weekly Value Area.
This indicates that I can now wait for a H4 reaction at the Weekly Value Area.
ENTRY: Only 2 H4 closed candles later there was strong selling from the WVA.
The entry was taken on the break of the low of the signal candle (yellow one) as the high of the yellow candle was NOT higher than the previous candle’s high.
STOP:
Above the Green Candle’s High. As always, you must expect to be stopped out on EVERY trade. That way you will remember to manage your risk because you will most likely lose this trade.
TARGETS:
The 1st Target was the low of the signal candle. It was an “easy” target to get to as the “market” just loves to fill these types of candles especially when the highs have been broken.
The 2nd Target was the 83.00 but I exited at the close of the long yellow candle as I was happy with that amount of profit in such a short space of time.
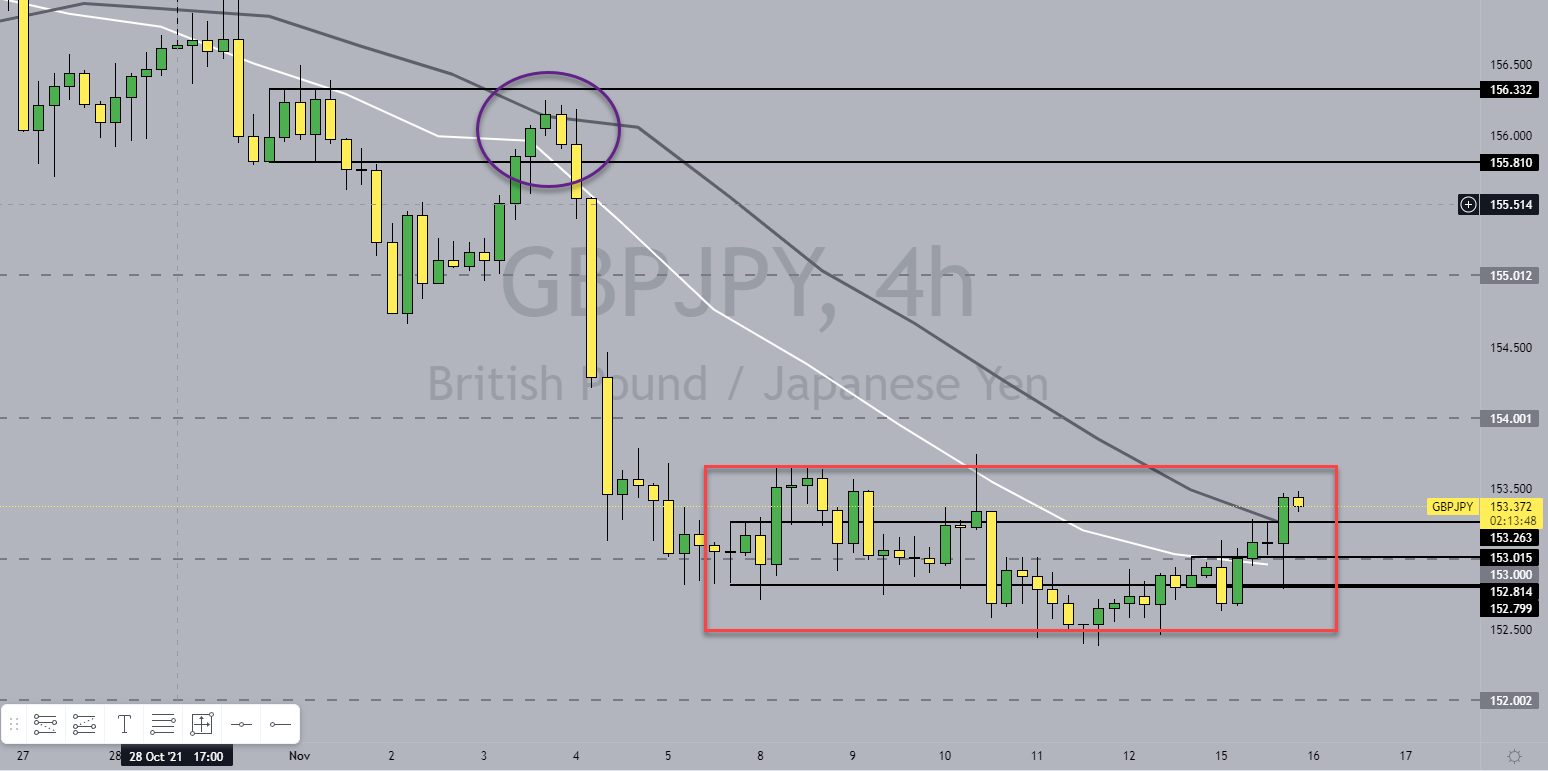
This is just a really fine example of when the market is being kind to the way I trade and when it is best to stay away.
I haven’t marked the trade up as this 1st trade in November’s Data Week is a great example to do some self study if anyone is interested to see what the rules I used for that Sell Trade.
Super interesting! I’m glad you decided to share your trade process. These are very detailed and I’m sure other traders, especially newbies, could pick up a thing or two. I also mostly use moving averages when I trade the daily, but I usually just trade 1 pair at a time so as to not get all stressed out. Excited to see more posts from you!
If anyone’s gonna follow the process, do you have a particular pair you recommend they try it out with? I see you use this for different pairs, but based on your experience, this strategy works best for which pair? Thank youuuu.
Thanks for sharing. Looks like very solid pullback trading method.
I am wondering, what is level of discretion in your trades. Are you always following the rules? So LWMA are in place, price goes back to weekly value area, closes outside and does it ALWAYS trigger a trade or are there any other “non rule based” factors?
Thank you for adding to the thread. It looks as though I’m only allowed to make a certain amount of reply posts per day because I’m new here. I’ll check in again tomorrow my time.
To be honest, I think there is a lot of discretion, and experience in the way I trade. That is the reason behind using the word “method” rather than “system”. I hope that makes sense.
I’m just presenting the framework here and by posting trades I hope some traders may find something interesting that may help them. It’s only early days, one day, so as the thread grows I’ll share more trades, both historical and real time and anyone who is interested will be able to gain a deeper insight into what I do.
Also, I always expect to lose every trade, so I guess that is not a method that would be very popular.
Totally understood. Thanks for clarification.
I thought this is heavy discretionary method. The problem with such methods is that it’s hard to have any expectancy and backtest
Trader needs to go through whole learning on mistakes phase on his own. Backtesting the method is actually backtesting the discretionary part and results are not very reliable (repeatable).
It looks like you’ve put your screen time to make it work and it’s awesome.
Yet, beginners should be aware, that profitable replication of this method may be long, hard and even impossible


 I’m glad you decided to share your trade process.
  I also mostly use moving averages when I trade the daily, but I usually just trade 1 pair at a time so as to not get all stressed out.
  Excited to see more posts from you!
  I see you use this for different pairs, but based on your experience, this strategy works best for which pair?
