Would like to take advantage of that offer. Perhaps you could add the rules on the same finished graphic. That would make it a complete reference work to hang on my wall.
Thanks, again.
Would like to take advantage of that offer. Perhaps you could add the rules on the same finished graphic. That would make it a complete reference work to hang on my wall.
Thanks, again.
NForex…that is a fantastic ‘cheat’ sheet. Obviously you put a bunch of time into it. Thanks
NFOREX Hi, I’m sorry for the confusion, but it was 1 AM when I sent for me, and I mingled with the finger and neurons …
Anyway congratulations again for the good work:)
NForex
Would also like to echo the positive comments on the flowchart that you have produced.
I find this a great learning tool.
Cheers
Turk:)
Good idea.
I put the rules in the print-black/white version.
Check it out:
Thanks everybody for your nice compliments. Makes me happy! 
Hi,
i was a follower of Tymen’s candlestick thread.
recently i happen to see this thread and started reading nearly 40 pages of it, when i shifted to last page, trades mentioned here doesn’t use GMMA and MMACD as he mentioned in earlier posts.
Can anyone tell me in which page i can get the recent setup required for trading? is there any PDF available?
Thanks in Advance.
Aarif, there are currently three PDFs available for this system since Tymen abandoned the GMMA/MMACD stuff as an object lesson in what doesn’t work.
I have attached the three docs assembled so far for this Bollinger Band DNA strategy and attached them to this thread. However, you ought probably go back at least several dozen pages if you want to keep up with what’s been discussed regarding pitfalls with this system so far.
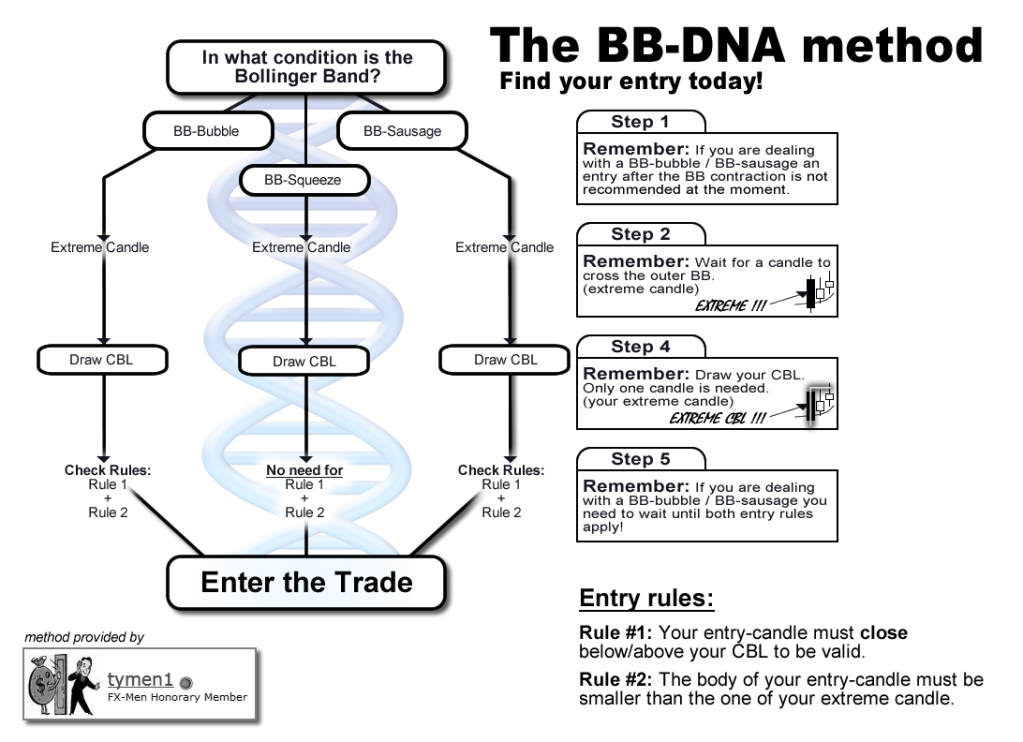
The first PDF is the theory portion of the lesson plan; the second is the layout of the four price action types; the third PDF details the Count Back Line entry rules.
Bollinger DNA method.pdf (454 KB)
Bollinger Band DNA Four Price Action Types.pdf (141 KB)
The Count Back Line Rules.pdf (91.9 KB)
Thank you so much Merchantprince
Great work NForex, very useful!
Thanks…
Hmmm, based on the definition of a squeeze that I follow and having just looked at the chart again I disagree.
This doesn’t look like a squeeze to me, but a bubble/sausage entry. As such, the rules state that a candle must close below the CBL which is smaller than the extreme candle.
There isn’t one on that chart.
However, I’m not saying that you arn’t making winning trades by ignoring that rule, just that sticking strictly to the rules there isn’t an entry to be made there.
Note - your definition of a bubble/sausage/squeeze may be different to mine, as it is a subjective analysis, so if it’s working for you - great! For me though, I wouldn’t be entering there…
Edit - If you can show me a good win/loss ratio by viewing that a squeeze then I may have to change my definition of what a sqeeze is! 
Hi,
Great thread tymen! I have been following ever since you decided to ditch indicators as I don’t believe in them to work as well as price action, although going back over the posts I do see some information was helpful with this type of trading. Since the start of this section however I have been following vividly and have thoroughly enjoyed your teaching style. I have been able to adapt to your style of trading with ease and have found it invaluable to my trading experience.
My question is in regards to the latest methods used . I was confused as to whether we are just trading the BB Squeeze/Level parts and no longer trading the retracement of Bubbles and Sausages like what was originally shown by tymen? 
If anyone could answer this question it would be greatly appreciated.
Cheers
I’ve only had a chance to glance at the new ‘do not trade’ diagrams, but it did seem that way after a quick inspection.
Will study them more and find a definitive answer.
Anyone else got any thoughts?
I’m personally surprised that we are no longer trading the retracements…my testing on these was showing great reliability and my demo testing on this method is yet to lose a trade.
I couldn’t get it to work on indices but it seems to work for me in FX quite well.
What I have just done is go through every one of my charts and convert them to a H1.
I had them at a smaller TF, and I think the reason for this was greed. I wanted to enter more trades.
Longer TF will mean less hit from the spreads, more reliable indications and less time in front of MT4 - which will mean less temptation to enter trades!
I’ve come to realise that what has been mentioned in other threads is quite true. It’s not about winning, but more about limiting the losses. This means using reliable information that is less susceptable to whipsaws.
Next week I plan to go back to January for every currency pair and do a full evaluation of each and every tradeable oppertunity for both the squeeze and the bubble methods, covering as many timeframes as possible. I’ll then upload all the data, along with pictures of the charts, to a webby somewhere so you guys can draw from it too. That’s if I get time! (I’ll be on night shifts, but should get an hour or two to myself hopefully)
javascript:void(0);
Just use the embed code photobucket provides after you upload your pic to their site.
Cordite Hello, thank you for trying to help me but I see no code appear after downloading the image, I’ll get a little better and try to understand …
I am a poor newbie, and French and more …