Great post Graviton and thankyou,
i saw you post this PDF last night onthe chatroom but didn’t get to read it. will have a read if now.
thanks for posting it in here now it’s permanent if we missed it in the chat room
Great post Graviton and thankyou,
i saw you post this PDF last night onthe chatroom but didn’t get to read it. will have a read if now.
thanks for posting it in here now it’s permanent if we missed it in the chat room
Thank you, [B]Graviton[/B], for posting this very valuable asset to this thread!! 
You have given this thread some respectability again!!
Looking thro, I agree with everything - who could not agree?!!
… there are only 4 reasons to hit a stop loss:
…
…
…
Moving a stop to close to price action volatility too fast - This is caused by trying to use the stop for something it’s not good for, locking in profits.
I am especially interested in the above quoted reason.
Traders on this thread are trying to lock in TP1 with a moving stop loss but a retracement awaits them and hence no TP2.
I have always felt that a stoploss is a last resort - hence I call it a PCI, and exits should be taken manually at the best possible point, assuming that one’s computer is functioning normally.
The stoploss then becomes a backstop for the spikes you mention, as well as electronic failures.
I agree with you that the aim is to get the best possible exit (positive) thro manual trading, and not use the stoploss to do it (negative) thro mechanical trading. 
That is why I am advocating the use of the parabolic sar as a PCI stoploss.
This is a primary use of the sar and to some extent, Philippe Cahen advocates this in his book, “Dynamic Technical Analysis”.
Taking profits on a peak rather than on a minimum with a stop loss refers to a Maximum Favorable Excursion Strategy. This is discussed in more detail in this pdf:…
I looked thro the PDF and I cannot say that I am impressed.
Scientists are always looking to be philosophical about things and this is of little use to the real world.
We are trading with real money in a real price action world and being dreamy and philosophising about this does not cut it with me.
Your answers are practical and real and that is how we should be looking at trading - there are too many of these weird books around!!
[B]In my following posts I intend to put legs to your counsel and try to be practical and real!![/B]
I am now going to attempt to integrate the business of setting a retracement proof stoploss and top quality exit all in one package.
To do so I am going to show 3 exit strategies…
use of the MACD.
use of the parabolic sar/mid BB.
use of Heikin Ashi candles.
The 3rd option, which I am very familiar with, has not been shown on this thread to date, and little of Heikin Ashi theory of any real quality come on this forum. I will change that.
[B]Each of the exit strategies uses the parabolic sar/mid BB as a stoploss line in a special way to be outlined in the following posts.[/B]
In the following charts, I need to point out a definition for future reference >>>
In each of these charts the price action is going long.
The parabolic sar is hence moving upwards but inverts itself when price retraces.
Note that the sar is in standard form when the price is going up in a long trade.
Note that the sar is inverted when we encounter retraces.
As such, the parabolic sar NEVER touches the price action.
This is what makes it so powerful as a PCI stoploss. 
[B]First I must establish an important criterion to go on…[/B]
As a stoploss, the parabolic sar is not acted on unless there is a close on the wrong side of the sar - for example, in a [U]long [/U]trade, we have a close [U]below [/U]the sar.
This will NEVER happen while the sar is in [U]standard form [/U]because of the nature of its mathematical derivation.
It only happens when the sar is in the [U]inverted form[/U] - and at that point we simply [U]pause the shifting of the stoploss[/U] and wait until the sar returns to standard form.
So the parabolic sar as a stoploss makes us feel secure because we know beforehand that the price action will NEVER touch it.
And when it inverts we simply wait for it to return to standard.
[B]But the price action may retrace very greatly while the sar is inverted!![/B]
[B]What do we do then?[/B] 
The [U]final word [/U]in the stoploss comes from the mid BB.
[B]If at any time, the live price action (not just the close) hits the mid BB, we exit the trade, even if the close give us a better exit.[/B]
We will now see how this outworks itself in the following posts.
I now look at a long trade and see how the 3 exit methods stack up against each other.
We will first examine a BB sausage >>>
In this case, a Di Napoli MACD and a parabolic sar have been added.
You can use this MACD which has the values……
FastEMA=8.3896;
SlowEMA=17.5185;
SignalEMA=9.0503;
or the standard MACD which has the values….
FastEMA=6
SlowEMA=19
SignalEMA=9
Here you can please yourself whether you want to use the parabolic sar or the mid BB as your stoploss.
In the case of using the MACD as your exit method, it does not really matter which one becomes your stoploss.
That is why I have put both the sar and the mid BB on the chart.
There are 2 exit points given by the MACD, the second being superior to first.
How do we know which to use? 
Gerald Appel, the inventor of the MACD, gives the following exit rules on page 177 in his book, “Technical Analysis, Power Tools for Active Investors.”…
…then ignore 1st signal but definitely take 2nd signal.
These factors are both true in the above chart so we take the 2nd exit signal for a great profit!!
This is a quality exit.
We now look at the same chart, this time using the parabolic sar/mid BB combination to do both jobs, that is, to give us a quality exit while operating as a stoploss at the same time.
Here is the chart again, this time with letters >>>
At point A, we spot and extreme candle and set up our CBL and enter.
We load a parabolic sar and set our stoploss at the low of the extreme candle.
The stoploss stays there right thro getting TP1 and does not move until it makes contact with the parabolic sar in standard form.
The stoploss makes contact with the sar just after hitting TP1, when the price action starts to rise upwards past the mid BB.
The stoploss is then moved along the parabolic sar line.
The price action reaches B, where we suspect a BB walk because the outer bands are starting to expand and the mid BB is going up.
The stoploss has moved in accordance with the PSAR.
At C, the parabolic sar, and hence the stoploss, cross the mid BB.
Remember, that the mid BB acts as our ultimate stoploss.
At D, the parabolic sar inverts - the stoploss is put on pause.
The close does not cross the sar - there is no exit.
We wait.
Then the sar returns to standard, and price action graduates to E where it crosses the upper BB.
This makes an excellent exit point.
If, after an inversion and restoration of the parabolic sar, the price action hits the outer BB, exit at that point.
This point usually makes the very best exit, and it is rare for the price action to improve much later after this.
Should we be careless and not exit at E, then we will see the price action retrace very rapidly and we then take the compulsory stoploss exit at point F, which is the mid BB.
PLEASE STUDY THIS POST CAREFULLY - THERE IS A LOT IN IT.
Point D will now be examined in greater detail.
Here we have point D greatly magnified >>>
Remember that the parabolic sar became inverted at this point.
The paused stoploss is shown extended as a red dashed line.
Note how the close of both the red candle (down) and the yellow candle (up) are both above the dashed stoploss.
Therefore, there is no exit at this point.
However, had the yellow candle hit the mid BB while under development, then that would have been an immediate exit.
This is my last post for the evening - it is getting very late.
Here we have a bubble + sausage combination >>>
We will see how, amazingly, we enter long with a CBL at point A, and exit at the very high quality point E. 
Our stoploss is set at the low of the extreme candle and follows the parabolic sar.
We feel secure because we know that the price action will never hit the sar!!
After the entry at point A, we get TP1 at the mid BB, then hit the upper band but wait for a possible expansion of the BB (which happens) in hope for a BB walk.
Our hopes are granted - the BB walk commences.
Normally we would use the simple exit method and exit at point B.
But we do not exit at point B, because we are using a superior method!!
At point C, the parabolic sar, and hence the stoploss, crossover the mid BB.
At point D, the parabolic sar inverts,and the stoploss is put on pause.
The following candle closes are above the extension of the stoploss.
So no exit.
We wait.
The parabolic sar returns to standard.
The price action then hits the upper BB signalling an exit but…
We have entered a squeeze (the end of the bubble) +
The mid BB is rising steeply +
The parabolic sar is in standard configuration.
We take the trouble to wait one more candle and this pays off because…
…the BB expand again for another BB walk!!
The stoploss follows the sar and finally at point E the sar inverts again.
This time the paused stoploss extension cuts thro a red candle and the close is below this extended stoploss.
We exit - a quality exit!!
NOTE - this trade was not cherry picked.
Fantastic work Tymen. Very practical. Very clear. Great to see you back in peak form. I’m taking this out for a test ride in demo today. It’s exciting! Thanks for your hard work on this.
[B]Excellent work, Tymen![/B] This is very similar to the Exit Method I had implemented in my Trade Plan, except that I only utilized the Middle Bollinger Band, as my Stop-Loss. I will begin looking at how to implement the Parabolic SAR immediately!
Happy pipping!
Tymen, I had a double take when you mentioned Heiken Ashi candles because I was going to send this idea - see charts below - 3 days ago but thought that I was a bit off the course that you were going along, so didn’t send it!!
I had found that after trying to effect a better exit following a BB walk, using various indicators, that nothing seemed to work for me. Then I hit upon HA candles and although I cannot backtest (only see the effect when looking at charts) they seem to give a reasonable exit.
I compared them with the MACD, using the parameters that you suggested. The exit signal is following a change of direction (colour) ot the HA candles. As can be seen here they seem to have the edge over the MACD.
Ken
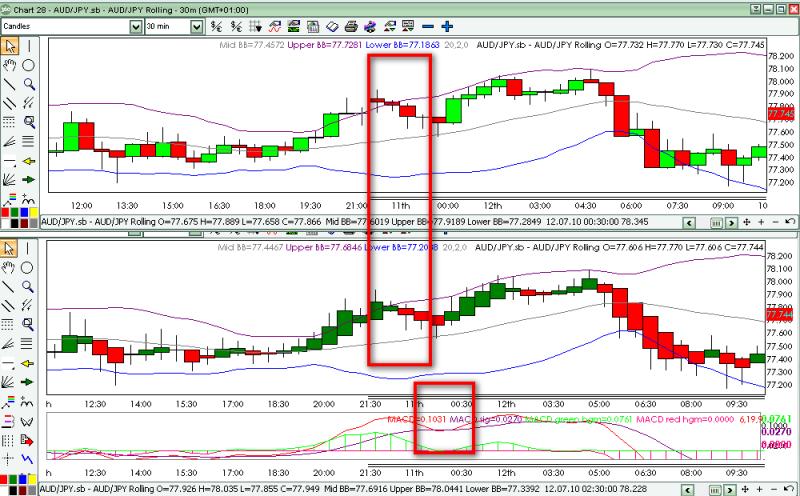
Could someone remind me of the SAR setting again?
Robk, on GFT DealBook the setting for the parabolicSAR are:
AFinc 0.02
AFmax 0.2
Sorry but I cannot tell you what the parameters refer to, but hope that this of help to you.
Ken
Those are standard PSAR settings. Just wanted to make sure if Tymen is using different ones.
Great work tymen!
I enjoy those bright colour illustrations of yours truly! 
OK, back to it.
Thank you to [B]Graviton, xXTrizzleXx, ken doubleU, robk[/B] and [B]fartist [/B]for your kind encouraging posts.
I am also interested in what result [B]Graviton [/B]comes up with after his testing of this exit method.
[U][B]There is a big question here…[/B][/U]
If the mid BB is the final absolute stoploss, then why do we bother having the parabolic sar?
[B][U]Answer[/U][/B]
We use 3 weapons in our trading arsenal…
A good trading method to give us at least a 50% win/loss ratio.
Good money management such as multiple entries, and break even stoploss techniques to nullify the house edge that is inherantly against us.
(I will have more to say about the house edge against us later).
Psychology - perseverence, confidence, absence of greed and fear.
It is the 3rd weapon I appeal to here.
The parabolic sar is an [B]encourager[/B] - we know that the price action is never going to pass thro the sar so we follow the sar with our stoploss in confidence, knowing that it will not get hit.
And when the sar inverts, the price action close has to go thro the extension of the last standard sar position.
This happens only towards the end of the trade - so that inspires even more confidence.
[B]The parabolic sar is used to inspire confidence in our trade.[/B]
Standard settings are used for the parabolic sar, [B]robk[/B].
Yes, I believe the HA candle exit method to be superior to the Di Napoli exit method.
But we have yet to see which of the two, HA or PSAR/mid BB is superior.
I will now turn to the Heikin Ashi candle exit method.
After that I will post more examples of each method so that you will not think that I am cherry picking the trades. 
First of all, a few necessary facts about HA candles.
They are average candles equivalent to a 2 period moving average, that is, the present candle and one previous candle are averaged to give the next candle.
The HA candle does NOT show true price, but rather an average.
In order to see true price, you need to either have an ordinary candle chart underneath as ken doubleU has done, or have the bid/ask lines visible on your HA chart.
HA candles are constructed according to a simple mathematical formula.
The most important part of a HA candle is the colour of the body.
A strong upward trend gives upper wicks only.
A strong downtrend gives lower wicks only.
Longer wicks on both ends with a small body tells us that the trend is breaking.
A change of colour is a sure indication of a trend break.
Since HA candles are derived from a formula, they need a starting point.
Every HA candle starts from the mid point of the previous candle body…this is shown in the chart below >>>
This is sufficient knowledge for us to proceed.