Thanks, Grav, on behalf of everyone who uses the chat room daily. For obvious reasons, I won’t go into details here, but that is very generous of you! Hopefully others will also chip in.
Thanks Tymen, I could tell I was confused, but I just wasn’t sure how confused. :o
If you’re good for 6 months why would others need to chip in? What else is needed? Sorry for being inquisitive, but I’m always weary of people asking for money online…especially for a Chat Room. There are hundreds of free chat rooms all over the internet, and many free options for desktop sharing…
Dodge, you’ve always been very clear on the fact you think the chat room is extraneous. That’s fine; others disagree. I will not go into the costs involved here, as they would violate BP policy discussing such matters – and the costs have already been detailed in the broadcast message sent out earlier.
As for chipping in (which others have already done in addition to Grav) that would be for the [I]annual[/I] cost - which is a discounted price.
I have not asked for any money for myself. To be honest with you, I wouldn’t have done any of this if I thought I’d be getting crap for it in a forum thread. I’ve spent a lot of my own time and effort to help Tymen communicate with his students (as have you) and I’ve never collected a cent for doing so.
No big deal. It’s taken care of. Let’s just move on. We have bigger fish to fry here.
Thanks,
Grav
I understand others concerns. If I didn’t know your intentions and all the hard work you’ve put in the chat room, I’d share the same concerns. In this case, everyone just chill. If my word is good for anything here, take it on this, there is nothing to be concerned about. Please, let’s just move on. The work being done here is important to many, including me personally. Let’s please stay on topic. Thanks.
Appreciate any advice on this cbl entry on the 30min, USDCHF which hit the SL. I was quite excited about this as it was a with trend entry. Candle 1 was the extreme candle and it was long so i cut it in half to get the cbl. Candle 2 price action initially went down to hit the cbl and give me entry short. Then in the same candle it went back up again to hit the SL on the extreme cbl candle!
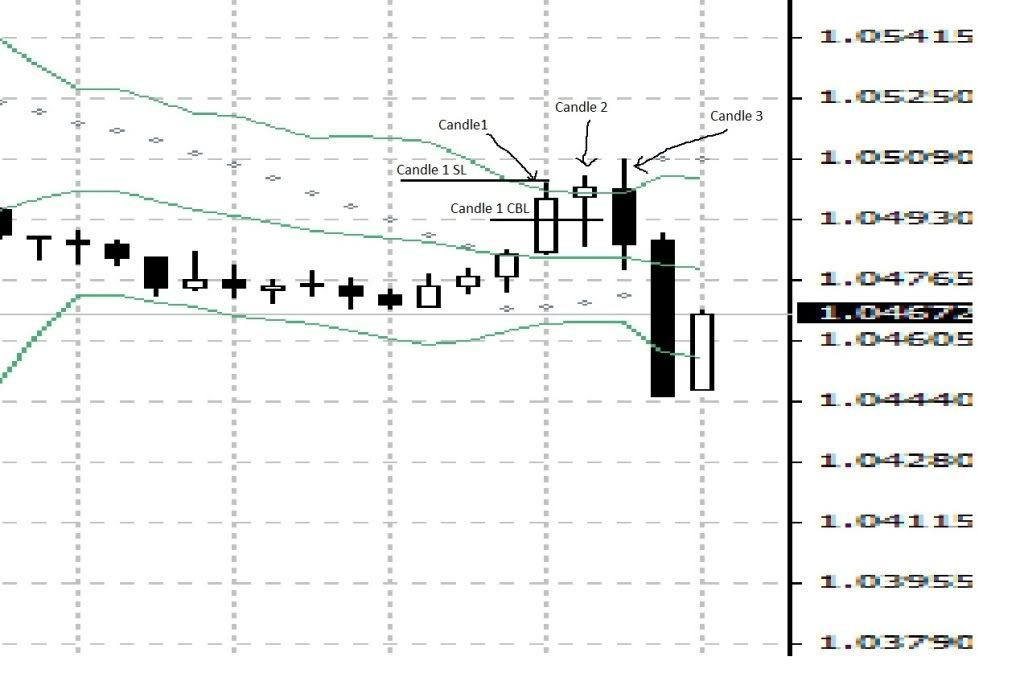
With hindsight now, we can see that the PA did go short and would have been an OB-OB trade. If i had taken the 1st SL on candle 1, I could have attempted another entry on Candle 2 a more extreme than candle 1. However if i did this, candle 3 would have knocked me out of the trade too as the PA went up past the SL of candle 2 and then went back down again. Was wondering how I could have successfully got into this trade? Did the USDCHF have something against me or did I do something wrong?
I can’t see the time frame or gmt time of the trade, so my comments are limited by that. Of course, following the rule of waiting for the candle to close avoids these head fakes. Following a 2 CBL entry rule does also. I believe Tymen prefers the 2 CBL entry and he’s traded this system more than anyone. You can make your own decsion, faster entry-more head fakes, better entry positions; slower entry-fewer head fakes, miss some good entry positions. I’m thinking you used 1 CBL entry before candle closed. I use additional complexity not used by Tymen to mitigate the additional risk incurred by these very fast entries, when I take them. I go through those more complex entry methods on my companion thread, Multi-Time Frame Trend Trading and I don’t want to go off topic here. The simplest solution is if you want to obtain the same results Tymen does with his system, you need to trade it just as he prefers, with 2 CBL entries. Just my own opinion, perhaps someone else has something better to add.
TraderAlan -
I cannot verify the sequence of actions, but guessing, that first entry was valid as it went short to get you into the trade BEFORE it made a new extreme candle?
In this case - dang the luck - losers do happen - but don’t give up on the trade, like you are asking, how to get back into it.
Again - the sequence, did candle 3 make a new extreme candle before hitting an entry price?
Then the question is - entry price is too close to MID - what happens then, according to DNA - you have TP1 of just a few pips, I think this is OK, especially if you’re just looking for a place to enter.
I will humbly submit one more entry criteria- I just noticed this a couple of times, where it did work, obviously I do not know if there were hundreds of times where it did NOT work.
If someone wants to review the idea - great- if not, I will keep an eye on it myself, but I am a very part timer here.
Alternate entry criteria 1:
If you are at an entry point, and dang the luck the candle you were about to enter on has made a new extreme candle, now you have to wait for the next candle - - OR IFF (if and only if) this current new extreme candle engulfs the previous extreme (note the previous DOES need to be an extreme) candle, then enter at the time the engulfing candle breaks the low of the previous extreme candle.
I guess - it is a normal entry, had the current candle NOT been an extreme candle -so it seems to be solid logic, in fact seems to be smart, as an engulfing candle is a nice indicator that price will keep moving in that direction?
So in TraderAlan’s situation - candle 3 became an engulfing candle so entry is at the low of the previous extreme candle - again very close to Mid BB, but the question is do you want to get in here?
P.S. - I am not trying to disagree with Graviton, I am just adding my 2cents.
Thank you for cooling the matter, [B]Graviton[/B]!! 
And thank you for paying part of the fee!!
I could also contribute but I must wait for my credit card (debit card!! - on overdraws for me  ) and then know how to use it for an overseas transaction such as this.
Meanwhile I really appreciate what [B]Merchantprince [/B]has been doing in setting up the whiteboard and the chatroom.
The stuff is away from Babypips and hence free from their censorship.
I could be wrong, but my intuition has made me suspect for a long time that there is some animosity between [B]Merchantprince [/B]and [B]DodgeV83[/B]. 
Has it got something to do with the fact that they both live in New York?
I have always hoped that I would be wrong in my suspicions, because both of these people have contributed major material that has been fundamental to the success of this thread and of the Bollinger DNA method.
I have received an important private message from [B]Rhodytrader[/B], [B](John [/B][B]Forman), Honorary FX Member[/B], our world master trader on this forum.
I have to answer a question for him and I am going to take the opportunity to ask him to come onto the chatroom, and invite him to give a lesson on the whiteboard!!
After all, he rubs shoulders with people such as John Bollinger himself!!
Thank you to [B]Graviton [/B]and [B]PerchTird [/B]for taking the weight off me by trying to answer [B]TraderAlan’s [/B]question.
I do not want to correct anything, just add confirming notes.
[B]TraderAlan’s [/B]entry was indeed quite valid - nothing wrong with it.
[B]PerchTird [/B]is correct in saying that we do have losers - and this is one of them.
A second entry using candle 2 causes another loss, a third entry on candle 3 remains a working order and does not enter.
The losses here are about 16 pips - no great amount.
P.S. - I am not trying to disagree with [B]Graviton[/B], I am just adding my 2cents.
Good move [B]PerchTird[/B].
That’s good. Am I correct in saying you prefer the 2 CBL entry Tymen?
Now I am going to set the rules for the quality exit once and for all - and index the posts.
We start here >>>

[B]In any BB bubble or sausage, long or short, there are 4 types of price action.
They are :
a) Initial breakout - diagram A.
b) Continuing price action - diagram B.
c) Level price action - diagram C.
d) Retracement price action - diagram D.
Condition A exit is delt with by way of an Extreme Bollinger Band with standard dev = 3.3.
Conditions B, C + D exits are delt with by way of the parabolic sar/mid Bollinger band method.[/B]
In the following diagram we assume a LONG trade.
The exit rules are the same for a SHORT trade but the picture is upside down.
In this diagram, the price action is shown by the green arrow >>>

The Bollinger Bands are in pink, the Parabolic sar in blue and an exteme Bollinger Band (standard dev = 3.3) is also shown in black.
Stoploss lines are in red.
Labels are also color coded.
[B]EXIT RULES :
A Parabolic Sar is loaded onto the chart.
The stoploss trails along the PSAR.
The stoploss always trails along the PSAR from the very beginning.
It never trails along the mid Bollinger band.
When the PSAR has not yet crossed the mid Bollinger band, (grey section), the PSAR is the only and ultimate stoploss.
After the PSAR has crossed the mid Bollinger band, (yellow section), the mid Bollinger band becomes the ultimate stoploss.
Because of its mathematical construction, the price action will never touch the PSAR.
Therefore, it is impossible to get a stoploss exit while the PSAR is in standard form.
Knowing this, the PSAR acts as an encourager as the price trends.
When the PSAR inverts, the trailing of the stoploss is halted and the stoploss line is extended to the right for the duration of the inversion.
When the PSAR returns to standard form, the stoploss continues to trail the PSAR once again.
An exit can only be obtained when…
a) The price action hits the Extreme 3.3 Bollinger band after several candles,
(Condition A).
b) When there is an inversion (Conditions B, C +D) :
[ul]
[li]An exit is made if the CLOSE passes thro the extension line of the stoploss during the inversion.
[/li][/ul]
[ul]
[li]An exit is made if the live price action hits the mid Bollinger band at any time during the inversion.
[/li][/ul]
c) An exit is made at the outer Bollinger band after an inversion, should the price action get there . (Assuming the trade is still underway). (Conditions B, C + D).[/B]
Thank you tymen! Now is very clear! 
Please note that I have gone back and edited the notes and reposted/edited the diagram several times!!
In addition, the 2 posts have been indexed and I wll make reference to them when needed.
I now invite [B]DodgeV83 [/B]to design his EA around those parameters!!
I also invite someone to make a PDF of the above 2 posts which depict the exit rules on a BB.
The Bollinger Band Exit Rules as outlined above have been compiled into the attached document and ready for downloading. I’ve also attached this document to the list of Essential Downloads on the homepage of the Bollinger Band DNA.
Bollinger Band Exit Rules.pdf (181 KB)
Hi tymen and all
I was demoing this Psar metod today
I found that SL extension area can rise to the upper band, in other words
Parabolic Sar invertion touchs the upper band. what If at same time extreme candle is formed. Should we exit imediatly and remove extendent SL as I open the trade in oposite direction?
thanks
Hi Renala!
Did you pick a PrintScreen of the trade? or could you please point out pair and time?
I can’t see at the moment how the inverted SAR could touch the upper BB in this case at the same time that a extreme candle is developing (so PA is bullish)
Bear with me… is mostly I’m such a newbie and I would prefer a graphic to refer later
For anyone running MT4 platform you may have noticed the default Bollinger Band indicator will not save a fractional BB standard deviation setting like 3.3
I didn’t even notice mine wasn’t saving the decimal part until Loppan pointed it out today.
You can type it in but it rounds off to just save the whole number 3 when you save it. Most MT4 platforms come preloaded with a custom indicator in the Custom Indicator list called Bands that will accept the 3.3 std dev setting, so using that is the solution.