The finest in trend trading

Nice! A wick indicator for me would be the cherry on top.

As far as the latest exit method being a failure, I wouldn’t worry about it. Look at Einstein, it took him thousands of tries for the lightbulb to work.

Kidding, I know it was Edison:D

I don’t think we need to get every pip (it would be nice) as much as we need to have a high percentage of wins. We can still make it with that. And you have done a very good job of it!

VulcanClassic and other users of GFT the chart below gives some idea of the ‘squeeze’ indicator. I have to tidy up the code yet but hope to release this in the next two days before going on holiday for 2 weeks.

I will send you a PM with regard to your request for a ‘wick’ indicator.

Ken.

Oh dear!

I’m really sorry for not being here for over a week!

I will get coding on those 2 new indicators sometime today!

It would be nice if you could PM me as well or post it here for all. :slight_smile:

I’ve just noticed the latest indicator has been decommissioned.

Real sorry to hear this.

I hope I can be of help in future.

At present I am trying to establish the exact requirements for the requested indicator, though I am unable presently to be able to send a PM to [B]VulcanClassic[/B] :confused:.

When/if an indicator is produced it will posted for all GFT users :slight_smile:

Ken.

Ken,

I saw your pm saying you tried to send one. I sent you one but not sure if I did it right.

[B]VulcanClassic[/B] thanks for PM - I was unable to send you one but could send a reply to yours okay.:confused:

Below is the code for the squeeze indicator for DealBook. There is an input setting that you will probably want to play around with: squeeze = 1.5 [my original setting].

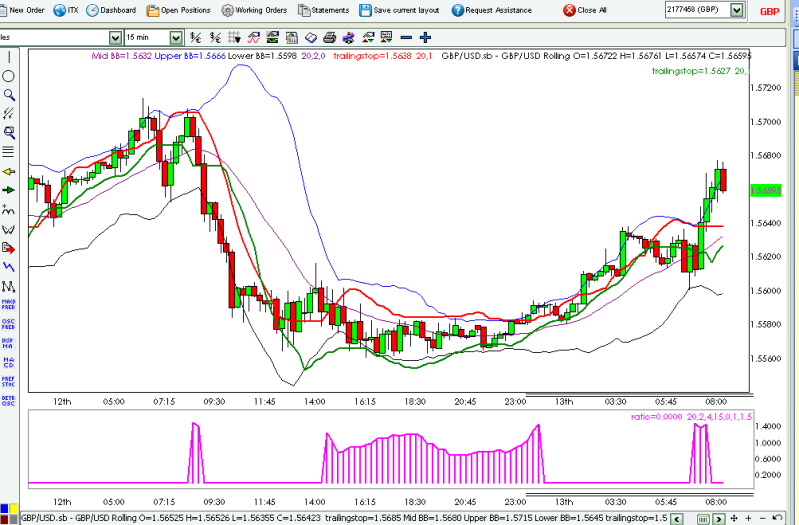
You can make small changes to see how it changes the sensitivity. Then decide by the effect, relative to squeezes on the chart above, where you want to leave it.

It is set to match Bollinger Band setting of 20 periods - but can be changed by P1.

As usual open a new page in ChartStudio, then copy and paste the code below. Save and Install; then you can use it from DealBook.

Ken.

///////////////////////////////////////////////

indicator AAA_squeeze_v1;
// contact ken doubleU for any problems
input squeeze = 1.5, P1 = 20, deviations = 2, P2 = 4, P3 = 15,
starc_factor = 1 ;

/* change the setting of ‘squeeze’ by small amounts
to effect the sensitivity. Judge the result by comparison
with the actual squeeze on the chart. */

draw ratio(“ratio”,histogram,dark_magenta,2);
vars tmp(series), tmp1 (series), i(number), lst(number),
mid(series), lower(series), lowerstarc(series),
midstarc(series), upper(series), upperstarc(series);
begin
lst := back(close);
if lst < P1 + P2 + P3 + 1 then return;
mid :=sma(close, P1);
tmp := deviations * stddev(close, P1);
upper := mid + tmp;
lower := mid - tmp;
midstarc := sma(close, P2);
tmp1 := starc_factor * mma(truerange(), P3);
upperstarc := midstarc + tmp1;
lowerstarc := midstarc - tmp1;
for i := front(close) to back(close) do begin
ratio[i] :=(upper[i] - lower[i])/(upperstarc[i] - lowerstarc[i]);
if ratio[i] > squeeze then ratio[i] := 0;
end;
end.

//////////////////////////////////////////////////////////////

Thanks Man! I know all GFT users here will appreciate your work. I do.

It is far too late now but there is a section on down below where EAs with all of the coding language is suppose to be discussed. I suggested this to the Admins over a year ago and they readily agreed. I don’t look in much anymore as a lot this arcane posting is about programming, not trading. And from a personal standpoint this thread started out as a lesson for a strategy and has now evolved into a “let’s try this, maybe it will work better.”

Have a nice weekend all - dobro

This thread is more of a collaboration of efforts to polish and improve on everyones trading skills. The posts are to do with the system discussed, even if they are about indicators. If you don’t want to read about indicators, skip the post.

But I think Tymen is simply trying to hone this down to the most efficient and effective method he can. We can’t fault him for changing and adapting as he goes, you never know it all. If anyone would know that, it would be a teacher.

[B]Please note the following statement by me in post #5 on page 1 of this thread…[/B]

I will be listing quite a bit of computer programming language which is used in the GFT program.

So your comment about this thread not being about trading is really quite out of place!! :frowning:
You were forwarned of the content of this thread on the very first page!! :stuck_out_tongue:

Furthermore, I reserve the right to put in this thread whatever is necessary to improve the success of the BB DNA method. :wink:

…and that is what I am doing.

Obviously, you do not like it - and have gone elsewhere.
Fine - each to their own in trading!! :slight_smile:

You can!!

Here is the latest exit indicator - [B]the Exitmeter.[/B] :smiley: :smiley: :smiley:

Before I post the Exitmeter, I want to explain how the squeeze indicator designed by Ken DoubleU works >>>

The program notes when the Starc bands go outside of the Bollinger bands.
The indicator blips at this point to show that the area in yellow is a squeeze area.

A good squeeze is about 25% of the width of the bubble/sausage at its widest point.

Now for a chart of the Exitmeter at work >>>

Here is a bubble showing the exitmeter at work.
When the red line crosses zero, we exit at the close of the earliest candle.

Here is the Exitmeter at work on a very complex BB sausage >>>

There are 3 separate entry/exits given by the 7 rules.
The exits form 2 losers and one winner.

Compare the above chart with the one below where the PSAR is used >>>

In this case, the PSAR does a far superior job, allowing only one entry and exit with a trailing stoploss.

The Exitmeter provides reasonable exits on bubbles but the PSAR is superior on sausages.

For the record, here is the GFT code of the Exitmeter.
I do not really like this thing, it does not give really high quality exits and there is no trailling stoploss to go with it.

[B]The principle of operation is this…[/B]

The rate of change of the [U]upper band[/U] is measured for the duration of the bubble/sausage.
Same for the [U]lower band.[/U]

Then upper is subtracted from the lower, and at some point the result of the subtraction = 0
This zero point is the exit point.

The Exitmeter code is my contribution, not that of [B]Ken DoubleU.[/B]


indicator AAA_BB_Exitmeter ;

input deviations = 2;

draw zeroline(“zeroline”, solid_line, blue,2),
resfinal(“Exitpoint”, solid_line, red,2);
vars i(number),avg(series), line_mid(series), tmp(series), line_upper(series), line_lower(series), res1(series), res2(series);

begin
zeroline := makeseries (front(close), back(close), 0);
line_mid := sma(close, 20);
tmp := deviations * stddev(close, 20);
line_upper := line_mid + tmp;
line_lower := line_mid - tmp;

for i := front(close) + 20 + 1 to back(close) do begin
res1[i] := line_upper[i] - line_upper[i-1];
res2[i] := line_lower[i] - line_lower[i-1];
resfinal[i] := res1[i]- res2[i];
end;
end.


END

Thank you [B]Tymen[/B] for giving a good explanation of the operation of this indicator, together with a great illustration.

That is an interesting fact that “a good squeeze is about 25% of the width of the bubble/sausage at its widest point”.

Ken.

[B]Tymen[/B] I suppose that you could still use the parabolic SAR for the trailing stoploss and the Exitmeter for the exit. That way you protect your position yet use the new indicator.

Yes, there are occasions when the parabolic SAR is better but equally I have seen other cases when the Exitmeter is better: so do not give up on your new baby!

Ken.