If it’s a retrace, was there a larger trend going on that you would have been part of, in the other direction?
I struggled with that early on in my trading.
While analyzing things backwards, I would see many points of entry that failed. But when I understood how longer time frames work, and the signatures of reversals, I realized that most likely I would have been in on the trade in the other direction at a far earlier point.
Look at it from that perspective, and see if it makes a difference:)
Such an EA can give me a signal (alert) when the price action comes close to a SR-line.
Then what it meant with “chose your speed”? Can anyone give a short explanation what the benefit of such an EA is and how i set it up?
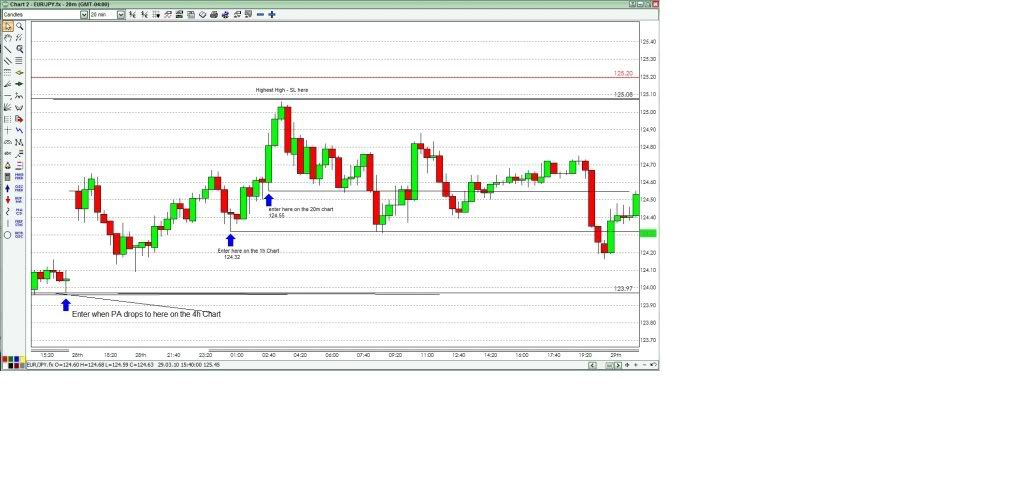
If anyone is willing to help me along while Tyman is moving I would be grateful. Attached is a chart (my 1st:D) of EUR/JPY today.
I have drawn the candle pattern as Tyman instructed. This is 4h. The 125.08 is a resistance line drawn from previous PA not shown to the left and it is my stop. 123.98 is my entry.
What I still don’t get is the lower time frame concept. If this is my home chart do I go to say a 1h and look for an earlier entry to go short? What if the 1h is in an uptrend? What if I go to the 20m and it’s in a downtrend? I realize that this looking at lower time frames is a valuable tool and many good traders utilize it but I have not been able to quite grasp what to do with the info that the lower time frames gives you with respect to your home chart. Thanks in advance for any help.
I have drawn the candle pattern as Tyman instructed. This is 4h. The 125.08 is a resistance line drawn from previous PA not shown to the left and it is my stop. 123.98 is my entry.
What I still don’t get is the lower time frame concept. If this is my home chart do I go to say a 1h and look for an earlier entry to go short? What if the 1h is in an uptrend? What if I go to the 20m and it’s in a downtrend? I realize that this looking at lower time frames is a valuable tool and many good traders utilize it but I have not been able to quite grasp what to do with the info that the lower time frames gives you with respect to your home chart. Thanks in advance for any help.[/QUOTE]
Unrepipant,
My 4h chart looks just like yours with same entry…I drilled down to the 1h chart and count back and show entry…I drilled down to 20m and count back and show entry. 20m gives about 50 more pips…but more whipsaw and drawndown. 1h gives less whipsaw and less drawdown so far… Tymen has not covered this yet I dont think. Sorry about the poor quality of my picture.
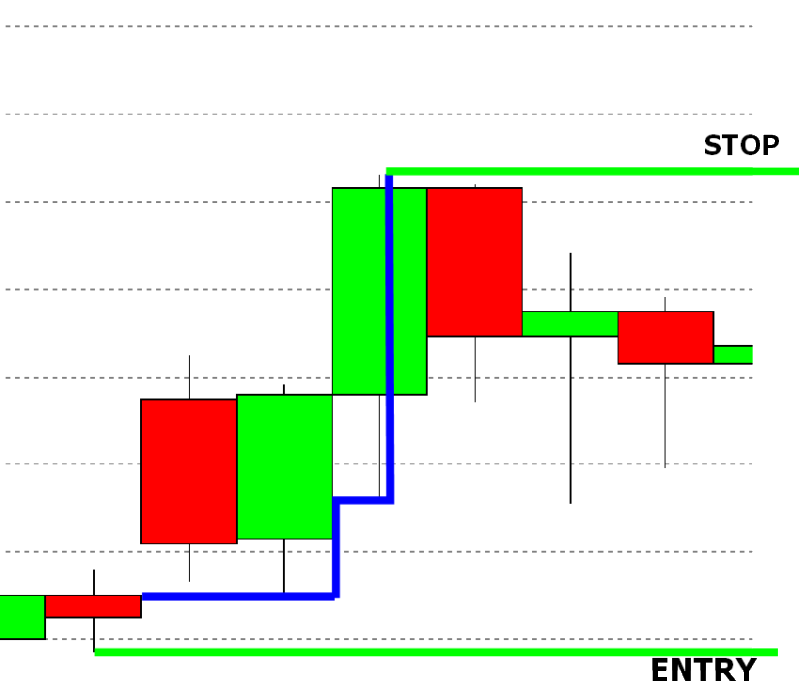
The count back line came from this point as in the previous chart.
The SHORT ENTRY line is shown.
It crosses the lower wick of a red candle - we enter here./QUOTE]
Compare your situation to this pic.
Looking for a retrace on the short time frame will get you a better entry is the idea.
Planning to go short like you are, you want your entry up near the top to keep your risk low, and your stop loss the most effective.
Higher timeframes are used to provide “guidance” for trading - basically they identify the direction in which you are going to place your trades for the session. If the higher timeframes (4h, daily, weekly) all show an uptrend, then your bias on the shorter timeframes (1h, 30m, 20m, etc) should be upward - that is, you will be going long on your trades.
If the higher timeframes show a downtrend, then on your shorter timeframes, you will be going short.
So, what happens when your shorter timeframes don’t line up with your longer timeframes (that is, the longer timeframes show an uptrend, but the lower timeframes show a downtrend)? You wait. Patience is the key, here.
Do not go short when the trend in the higher timeframe shows a bias for longs, you are more likely to be stopped out. The same is true for going long when the higher timeframe bias is for shorts.
Now - to apply it more to Tymen’s method:
Disagreement between the two timeframes (say the daily and 1h) is good!
You start drawing your CBL’s when this disagreement is occurring, so you can get the best possible entries! This prevents you from jumping in in the middle (or even worse - just at the end!) of a trend, so you can maximize pips!
As I see it, the idea behind these CBL’s is to get into the trend identified by the higher timeframes at the optimum time on the lower time frames. This lowers your risk, and increases your gain - making your Risk/Reward ratio more favorable.
Hello evryone, Nice joy, Got to this thrend abit late(like 1hr ago) but it looking very interesting and i just got some questions, i would love to get the lastest MMACD indicator can anyone post it or tell me where the post is?. I use meta trader by the way.
Also in Tymen’s naked trading, How do you identify the summit of a perticular trade b4 you now decide to trade the opposite direction?
Thanks
Hi ADELEKE
with regard to the naked trading method, please be aware that Tymen has only just started posting this and things may change, Practice drawing the S/R and CBL but caution if considering live trading at the moment. As to your question, by continuing to draw CBL and updating the CBL line when a new high or low is made you will discover the the top or bottom of the trend. At the moment, the decision to trade is made when the CBL is hit or breached.
The MMACD indicator was introduced to provide an indicator based trading system, and, as such, it was later revealed that the system does not work (at least over a long period of time).
I’m guessing that you already read through most of the thread, since you know about the naked trading stuff - so I hope I haven’t ruined the spectacle for you.
If you still want the indicator for your own testing, you can find it in post #1508.
So just to clarify on what was said above, the primary object of this is to identify when a retracement from the main trend is done and it is returning to the main trend? is that correct?
Hi
The object is to find the extreme candle of a sustained up or down movement. When the extreme candle is found, we can then reasonably expect a reversal. It is not possible to know where in the movement we are unless we are at one of the extremes ie. top or bottom
Congratulations on inserting a chart. I have tried but failed! I did a ‘Print Screen’ before pasting into Paint. But I have a two monitor setup and unfortunately then I have both screens copied.
Undaunted I have produced my picture below by a rather longer route but I will try to find another method the next time.
My reason for sending this reply Unrepipant is that though I agree your Stop and Entry points, I think that your method of finding the correct Entry is not exactly as Tymen has shown. [see posts starting from #1522]
His moves were down, left, down, left. As the candle to start from should be the one with the ‘highest high’ - the green one. So starting at the ‘green’ candle would take you to the same point in this case but there would be other situations when your entry would be different.
The extract below shows how I think the method should be applied.
Ken.
PS. some problems uploading chart initially - but hopefully success now!
I think you’ll find that it’s actually “bottom, left, bottom, left, [U][B]bottom[/B][/U]” for plotting a short CBL. See post #1541. Don’t forget the last bottom.
In post #1522 he says “top, left, top, left, [U][B]top[/B][/U].” ([U][B]3 [/B][/U]tops).
So in essence there are always 2 lefts and 3 bottoms/tops.

 o:o
o:o