ICT, I can’t say it enough - You are a legend!  I was just watching one of the old “25 days of ForeXmas videos” and I felt I needed to remind you
Had a nice yellow line sitting at 1.2260 short term support on forex ltd mt4, figured a short term bounce here for 20 pips/ 10 sl - limit order sitting since 10.00 gmt, adr low at 1.2258 - great.
Reason for tight stop - if price goes down to 1.2258 - some stops there, next stops below that at 1.2238 - too far away for me. Fiber falling but not cable - reported reason was the spat ref China & Japan - making no sense to me so I figure real reason was the stops.
15.00 gmt mt4 reported low of 1.2258 high of 1.2288 - big smile - that is until I log into live a/c - order still sitting there,
Low on uk sites reported at 1.2264 - just shows how these little differences count.
My view on these tighter trades - I’m happier to miss out on a successful trade than to join an unsuccessful one.
I’m also happier that I’ve read the bounce, lesson learned, check the feed differences if trading that tight.
(btw spread on fiber on UK spreading betting only 1 pip - makes for tighter little scalps like todays)
In the beginning this is true… look for a solid Trade Setup weekly… One Shot One Kill.
As you graduate in patience and discipline… and the fish sit still in the barrell… by all means… unload.
Recall your posts a few short months ago and the level of frustration you experienced… feels foolish now doesn’t it?
I know it can be rather challenging at times and for those just starting out it can feel down right IMPOSSIBLE or that it’s not going to work for “you”. Take comfort in the likes of Piphanger… he’s a Forex Zombie back from the grave… but sometimes you just can’t keep a good one down. :13:
Hey Marcus!
Thanks for jumping into the plasma pool and sharing your thoughts. Here is a bit of advice… take it for what it’s worth… when posting… post your thoughts. Don’t ask what others are thinking about your idea. DO the work, come to the choice and trade idea on your own… then post it and “release it”. If you post with the interest or feedback from others you will hinder your personal development. Allow the failures to come in as they will… this is going to occur by simply allowing yourself to be wrong and learning from it.
Asking opinions from veterans feels like the thing to do… and it might bolster confidence on the present moment… but remember… we aren’t sitting there with you when the Trades turn sour and you experience the chemical zone fear and greed induce. Trust yourself and trust that losses and or incorrect analysis is part of a winning approach!
Keep on trucking and don’t stop posting! :57:
That’s for your response ICT. I have a difficult time putting my thoughts into typed words. I didn’t not mean to imply I was only going to trade the setup based on other opinions and comments. I am really new to your tools and just now starting see how to use them in my trading ideas. I am watching the setup and will take the trade ( win or lose). I am waiting to see if it conforms to my rules. If it does I will trade. If not I will pass. I really just meant to put it out as an idea I am watching. I might be misusing the tools, but after the trade I will evaluate and see what went wrong if it is a loser. I have been doing good lately have price come to me instead of me chasing price. Patience is my main foe.
Thanks for all that you do ICT.
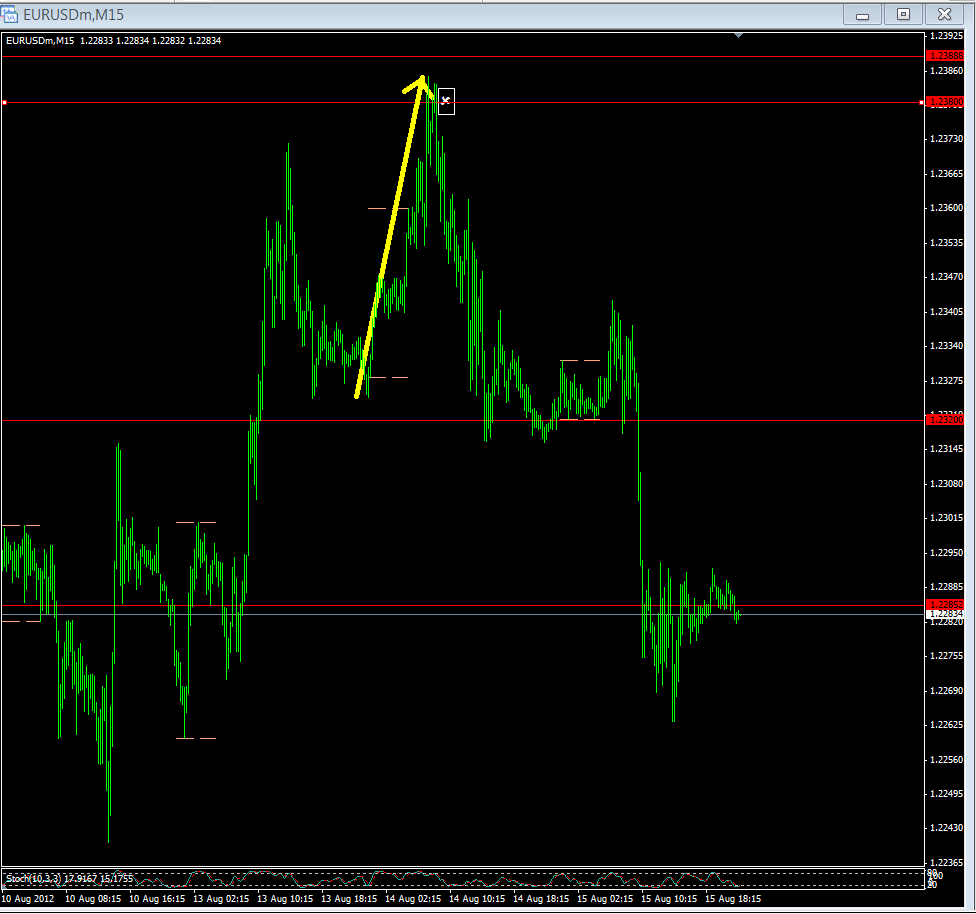
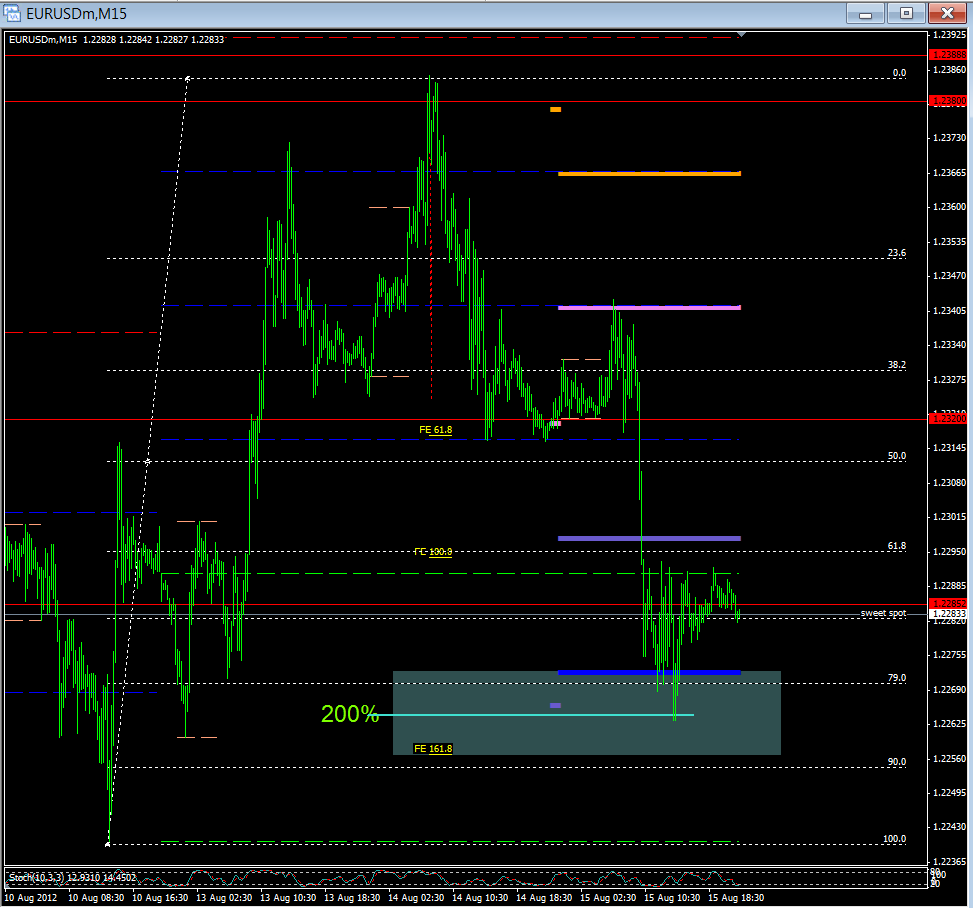
Hey SML, I just wanted to give you an example of take profit targets and how we get them…
So I took a short at 1.2380 on Tuesday’s LO (the white X) and you’ll notice that the dominant price swing moving into that area where I shorted the pair is marked with the yellow arrow
We want to measure that move to give us an idea of where price might go, so we can use a fib, pulling from swing low to swing high and marking the 200% ext (light blue line). We can also use the fib ext tool which showed the 161.8% ext just below that 200% fib level.
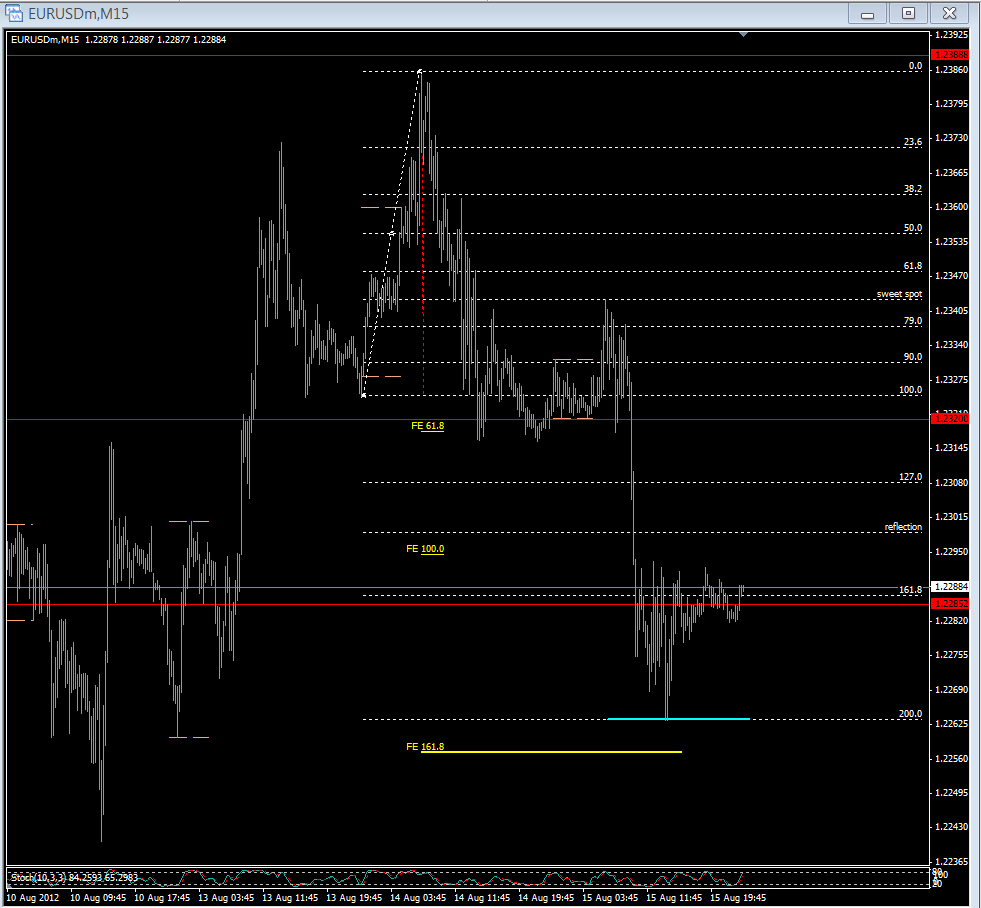
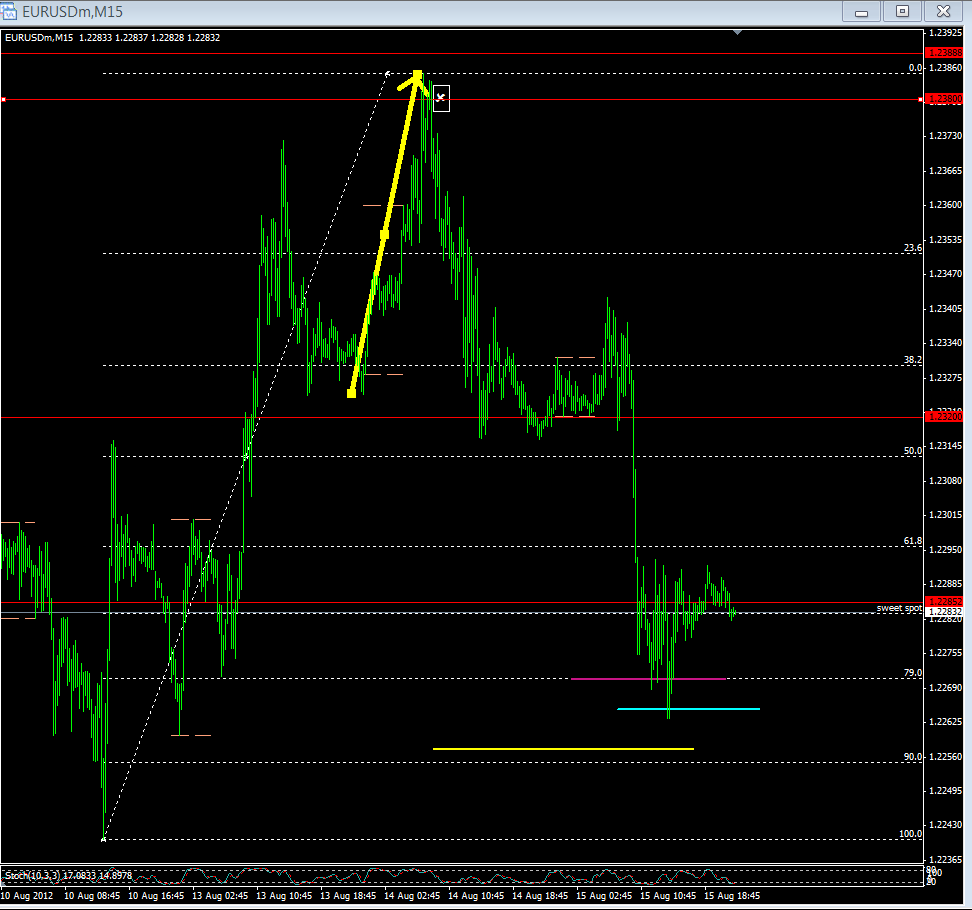
Also, right in that same area we have the 79% retracement of a higher TF swing in price.
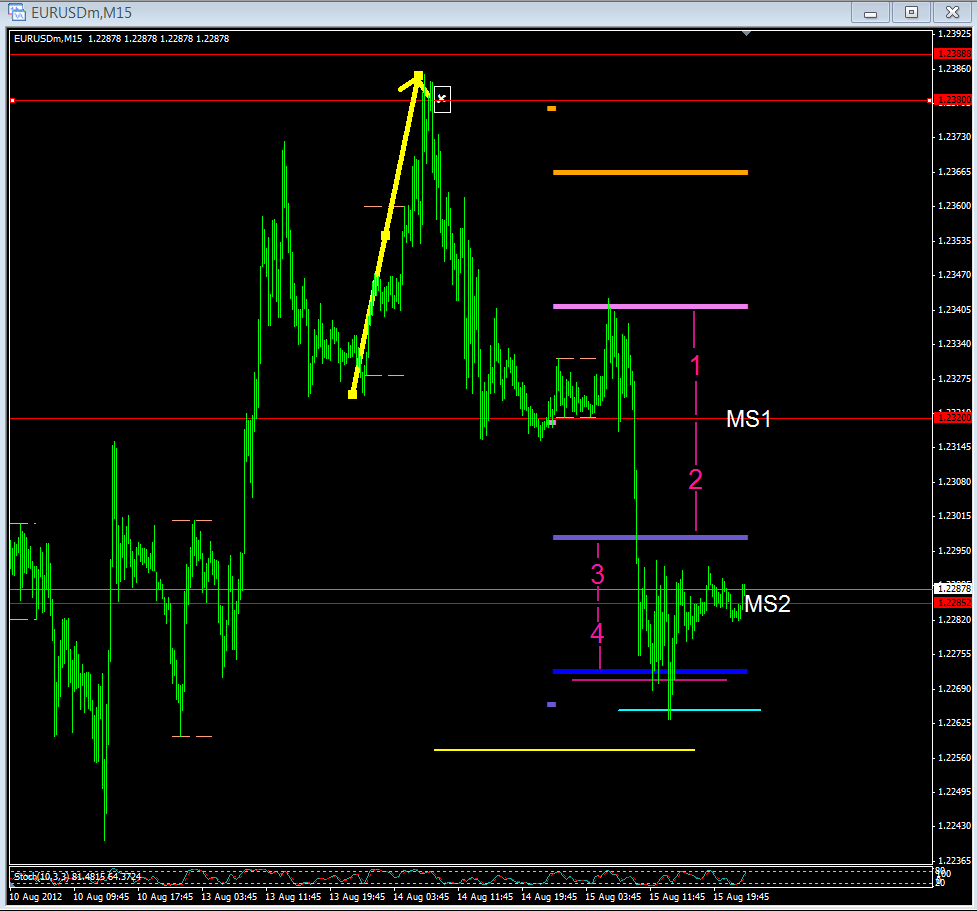
Finally, remember that I mentioned that price tends to move 4 levels per day…So price peaked at the central pivot and then moved 1 level to MS1, 2 levels to S1, and so on until the S2 level was reached
continued on the next post…
Now, put that all together and you get five good confluences of where price might reasonably go (and turn around perhaps). So you now have a profit-taking-zone to shoot for (grey rectangle), and price just happened to go right to the center of it right around 15:00 GMT, actually slightly before, but we don’t need to always be greedy and hold to the very end. ; )
Hope that helps.
Matty
Is that avatrader?? I’ve been looking into opening a practice acct w/them to analyze exactly what you are looking at, but i don’t think they offer membership to US residents. Any idea if that is correct???
I wud like to sincerely thank ICT for putting in the time and effort to make FREE educational trading videos for newbies
like us. I have watched most of ur videos and learned a lot.
I use some of ur strategies like OTE.
I went live few days ago and have increased my account size by $$%.
I know its too early to count myself as a successful trader but i wanted to
thank u cuz ur videos did help me learn alot and has contributed to my success.
Puremuscle, any chance you can shoot me a lnk for those videos? I havenot seen them. I’m not missing them in an obvious place am I? Thanks.
they are on the first page of the old thread, and were put out under the 25 day of Christmas. Since ICT reposted them, they are no longer listed as the “Christmas videos” (it was one heck of a December though, new presents under the tree almost every day)
Some of the BP guys were using a demo account a few months back that had the treasuries on…maybe someone could chime in with some advice here. I use an offshore broker based out of Luxembourg geared to ex-pat investors. It is generally accepted that USDJPY has an inverse correlation with the treasuries. Last night the 10 yr note was selling while the USDJPY was moving up. By running a fib projection on the 1H treasuries you could see that it was moving down to support which coincided with the 1.68 extension. At the same time USDJPY was gunning for the 79.00 Fig/H4 50% retrace which was also an H1 reflection. It hit to the pip as treasuries stalled, and came down by 40 pips, but the higher TF Daily is coming up off OTE so it is very much counter-trend and just a blip, as evidenced by the continuation.
I don’t trade Yen on a short term basis, but the treasuries interest me as sentiment seems to be focused towards risk-on/risk-off in the current environment. As treasury PRICES (not yields) decline, there is upward pressure on the foreign currencies, which is more evident in the stronger Cable (as opposed to Fiber). The pausing on treasuries at the 1.68 Ext coincided with the move down in Fiber, with the downward pressure relenting once the treasuries continued their move down. So why did Fiber move, and not Cable? Well Fiber is the weaker of the two, everyone knows that, but the real reason is that they wanted to gun the stops below 0.7826 on EUR/GBP so they held Cable and sold off Euro. The entry into this trade was a perfect 79% retracement…BOOM!
Of course it is not necessary to track all of these relationships. I am merely highlighting them here as evidence that these tools are at the heart of the intermarket picture. The focus/drivers of the market may change from time to time, and illiquid markets may weaken market structure sometimes, but there is a theme that runs through this beast!
Regards
im in the US and i have an avafx demo
Can someone please remind me what to type in the search box on Bloomberg to add the 10 and 30 year US treasury bonds to a chart?
Perfect! Thanks
usgg10yr:ind
usgg30yr:ind
okay this morning i have been messing with the EUR chart due to moderate frustration at my NY reversal long yesterday…needless to say it went BE… anyway… I now have 2 x confluences why I am expecting 1.1835 ish as a target for EUR, so question i guess is why not short it now?? Fear, Greed … take your pick… so I thought hey try and apply ICT concepts to see if I can arrive to the target… problem being… it’s probably 10 or so working days in the future i need…
Today I have set a pending Long alarm @ 1.2223 as a possible daily low to go long from I am hoping it will come in NY KZ… this kinda coincides with S2 if u like pivots… (I pay attention to pivots which are banks s/r ;-p). I guess if this turns into fruition I would be looking for an upside objective of either 1.2500 or 1.2550… at which point I would then look to short the hell outa it to my target of 1.1835…I am hoping this would coincide with Sept and some sort of ‘Normal’ trading!
So is trading just random market movements or is there really a cycle which few manage to unlock.
Please excuse the random waffling of a newbie…I just thought I would put myself out there for ridicule…
Squidge, you are trying to run before you can walk, I’d say you’re starting to get a grasp on trading, but you’re trying to apply what you understand without being able to use the rest of it, it’s like you’re trying to drive a car and the only thing you know is to start it and press the accelerator, just steady on, stick at it and keep learning.
I’m guessing here but you’ve got the grasp of some of the long term stuff, but you need to be conversant with the Judas swing and the OTE at least.
In my opinion the 1.2223 just isn’t a support level, it’s not in an OTE region, yesterday was bearish from a Fractal, so most likely it will continue the trend straight past it. I’m looking at a potential short from under 1.2300, it’s an OTE area on the last market move.
That’s a fair point Purple, as i said it was my random waffling which i dont usually do…
Was just trying to make sense of a few things… that’s why im a NOOb and you are FX Men 
