Hi Tommy i took a short right at that level too.Mainly due to resistance area and confluance of pivot zones, and fibo. What about you? Happy you took some off, i did not get the chance (my fault i was away from mt4)(As ICT says you never give pips back to the market no way no how. Looking at it back now i should have stayed out as london open typically posts the high or low of the day, that alone should have maybe worned me off? I think ICT will be kind enough to discuss this a little more in detail in market review hopefully.
Hi MWP, to be honest I was looking at MS being bearish based on analysis from Sunday and as I’d been away from the charts for a few days with work I probably shouldn’t have even been trading without looking at them again.
I mainly had the same thoughts as you.
Looks like the MS has changed in particular today so I’ll have a proper look tomorrow morning after Asia and see if I fancy anything.
NFP tomorrow though so may be best just watching to be honest.
Take care.

Russian Prime Minister Dmitri Medvedev tries out a couple of Michael’s Russian toys — a nifty belt-fed automatic rifle,
and his “baby” machine gun, the one on wheels. (Michael’s big-boy machine gun is too much for Dmitri to handle.)
Reminds me of that simpsons episode where moe is introducing his cross gun where he modified it to shoot 5 guns lol
:18: awesome! well, let’s seek to score many of these
ICT,
I’m just loving the Trading Development Plan series.
I’ve been following your work for a while and (so far) this series has given me a nice structured layout to using the tools you have shared with us over the last few years.
My trading has gone from mainly negative to mainly positive months. I’m aiming to go full time once I have 12 consecutive months and do have the feeling (and trading results) that I am getting nearer to this.
So thanks for all your time and effort.
Watching the charts and price is consolidating ready to shoot before the NFP report comes out. I have a feeling that price for fibre possibly will shoot up first sweeping 1.3030 high then pullback below 1.2980 level and resume higher to probably break the 1.3000 level gaining all the way up to maybe 1.3080 to 1.3100 level?. This is only my 2 p worth , just what i feel will happen i will stay out in any case. Would be interesting to watch what happens  What do you think?
A few guesses floating around in the other thread: 301 Moved Permanently
Does anyone remember how to get the current price of OTE to show on the fib? Is it in the fib concepts video? PC blue screened, had to buy a lap top and start from scratch…
Put these two characters [B]%$[/B] into fibo level description (right click -> Fibo properties)
Thank you sir
Hi traders (and ICT), Just figured I would jump in and say hi to everyone. I just ran across ICT a week or so ago and have been greatly enjoying everything that I’ve been reading and watching so far. I still have a number of videos to watch and I haven’t even started on the 1000+ page thread or this almost 500 page thread yet.
One thing I’ve noticed is that on the other thread in newbie island, ICT has made a ZIP file available with a number of indicators that he uses (innercircletrader_indicators.zip). I apologize if this question has already been asked, but is there a chance that the non-compiled MQ4 version of the indicators are available? I use a combination of ThinkOrSwim and some custom C# software I’ve written myself for charting / analysis. Usually I can take MQ4 scripts and translate them to the format I need for the software I use, but I can’t do that with the pre-compiled EX4 versions.
Thanks.
Zackron, welcome to the ICT community, there is a download here ( in Shaer’s post, download from Tansen, not sure if is what you need.
http://forums.babypips.com/newbie-island/36328-what-every-new-aspiring-forex-trader-still-wants-know-1001.html
Nah - just checked - but I know it is somewhere in the threads.
Front page of Time magazine - printed in green - Ireland is " finding solutions for Europe".
The Euro is not dead yet
I know that ICT is a fan of Larry Williams. I found this book: [I]Long-Term Secrets to Short-Term Trading[/I], it looks worth while and just want see if anyone had any comments on quality.
Ok guys this is basically my reasoning for yesterday using what we have been told so far and applying it to GBP/USD.
So looking at the weekly charts it was looking like price was at the top of a range/consolidation.

Zooming in through daily it was clear that price had reacted to the previous high at 1.63. So looking for breaks downwards for shorts was on my mind.
Then I looked at the 4 hour chart. Price was consolidating then appeared to break downwards through support. Making lower lows. I marked this on this screenshot with a yellow line.
Due to price breaking downwards after reaching a higher time frame resistance level marked on the weekly it was time to look for OTE’s on the 4h looking to short. On the principle that as a turning point is reached and market flow changes we can start to look for OTE’s to get in line with price.
In the screen shot we can see the support marked with yellow which was broken which to me indicated a market flow heading short. I drew the fibb tool down the move which made the break. Price then hit the OTE level.

Next I zoomed in to the 1 hour time frame. Here I see a confluence between the OTE, Weekly Pivot, CCI (my indicator of choice) was over bought and a previous higher time frame support was there which may act as resistance. The yellow lines on the top right indicate levels which I thought if broken would indicate a direction of market flow. Due to the confluences I was hoping/expecting for a break downwards

I zoomed into the 5m chart and waited for action.
Price moved into a consolidation throughout the day and a seek and destroy pattern in my opinion was developing.
Price moved briefly bellow the low marked in yellow hunting stops. Then moved up above the high marked in yellow I assume to do the same. This then hit the sweet spot from the 4 hour fibb. Price then moved down in the London close kill zone breaking market structure indicating a flow towards shorting. Price moved up a little to the support it broke retesting it however not quite making the OTE pattern then it smashed downwards until the market closed.

If the break was earlier in the day I would have be looking for an OTE to get short; by drawing a fibb on the down move which broke structure. However it was the end of friday’s trading day so I sat out.
Have I got the right idea?
Michael
A request - please consider changing the PTC trade review(s) to a different chart colour - perhaps black on white. Even in HD, with the green on black, it is often difficult to discern candles and prices, due to the green fluorescence. In comparison, the black on white charts that Chris Lori uses are very easy on the eye.
Thanks
Rod
Rod does have a point. I am fine on my end but I get what he is talking about. Maybe make them red and green just a thought
The more I trade OTE’s the more they look like Early Harmonic signals from C to D Gartely and AB=CD Patterns. If you have any idea what I’m talking about then you’ll know this is “unconventional” as far as harmonics go BUT it works time and time again. The AB=CD and XABCD patterns we’ve been trading through the OTE trades without evening knowing it. Holy crap how did I or anyone else not notice this one defining fact. It makes so much more sense. Now that I’ve realized this it is sooooooo much easier to estimate where any given trade should be entered/exited. If any of the below explanation intrigues you check out TMoneyBags thread on harmonic trading here @ babypips.
Thank you ICT even if you disagree with me we can agree to disagree agreeably…
Please note the the explanation below is only pointing out how helpful OTE’s can be when used in combination with the Gartley or ab=cd patterns. I look for patterns to form at specific pre determined support or resistance levels. That’s it nothing more to it.
ICT has a much more top down statistical approach to the markets which might be and probably is better for newbies and experienced traders alike. What it all comes down to is your personal style and what your comfortable with. I’m not trying to convert anyone to another style of trading though it may sound that way. For the last 2 or so years forex has been a money sink of mine with no real return on investment on till recently due to combining my two most researched methods (Harmonics & ICT’s teachings).
Short explanation
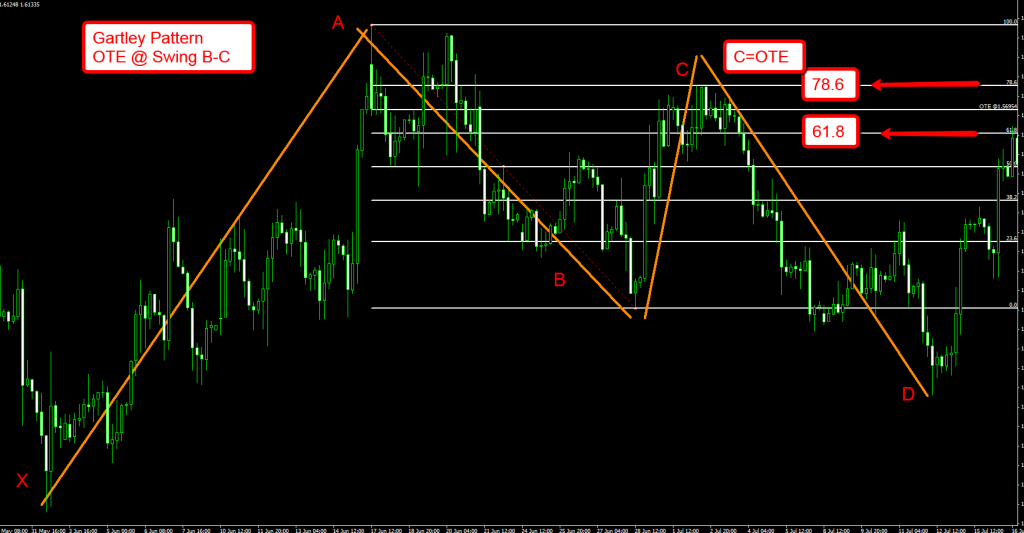
Swing A to B is our main or sub trend retracement swing B C is where the OTE forms and C to D is the classic OTE trade unfolding. XABCD is the whole harmonic pattern and D is where the traditional harmonic entry occurs usually forming another OTE which would define the pattern a GARTLEY giving a buy or sell signal.
Here are two visual examples
First direct links to photobucket for full size images
Gartley pattern OTE @ BC http://i1083.photobucket.com/albums/j382/johnny2pips/XABCD_OTE_CD.png
Gartley pattern OTE @ CD http://i1083.photobucket.com/albums/j382/johnny2pips/XABCD_OTE_BC.png
In forum embedded image
Gartley pattern OTE @ BC
Gartley pattern OTE @ CD
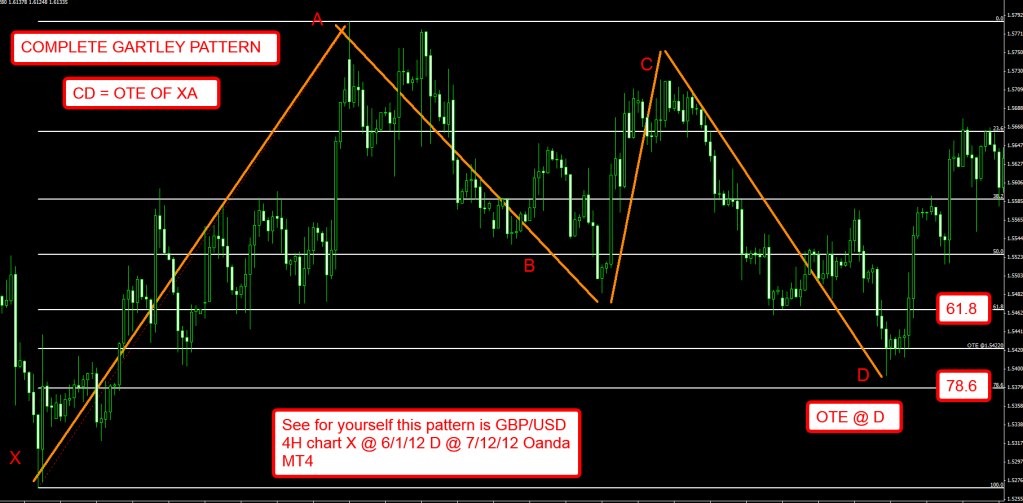
As you can see above swing CD is a OTE of XA
This really has been the light at the end of the tunnel so to speak for me personally it filled the gaps in harmonics I just couldn’t put the pieces together before. Amazing really if you’ve done any previous harmonic studies you would be thinking wow that totally makes sense. If not well your probably thinking what the hell is this gibberish. If that is the case I urge you to stick with ICT’s methods because they do work and will always work in any and every market because it is all based on chaos theory. ICT states it like this the markets are engineered to go up, down, or act a certain way at a certain point. Harmonics state it as chaos theory either way you get the same result consistent profits. Chaos theory as it pertains to the markets is when something (price charts) appear to be complete chaos (without order) when in fact when one looks close enough at the right place order can be not only found but predicted. Hopefully that makes sense.
Personally IMHO ICT makes it easier to understand for beginners. Although it is easier for me to see OTE’s within harmonic patterns such as the Gartley XA trade @ D noted above. This also adds another level of confirmation to OTE signals 
Wishing everyone a wonderful fall & winter,
Johnny
Anyone have the answer to Palmy’s question? I also noticed this and am wondering.
Thanks!