Absolutely legendary bro!  I am so very glad to see you killing it like this, all the hard work you’ve put in has paid off!
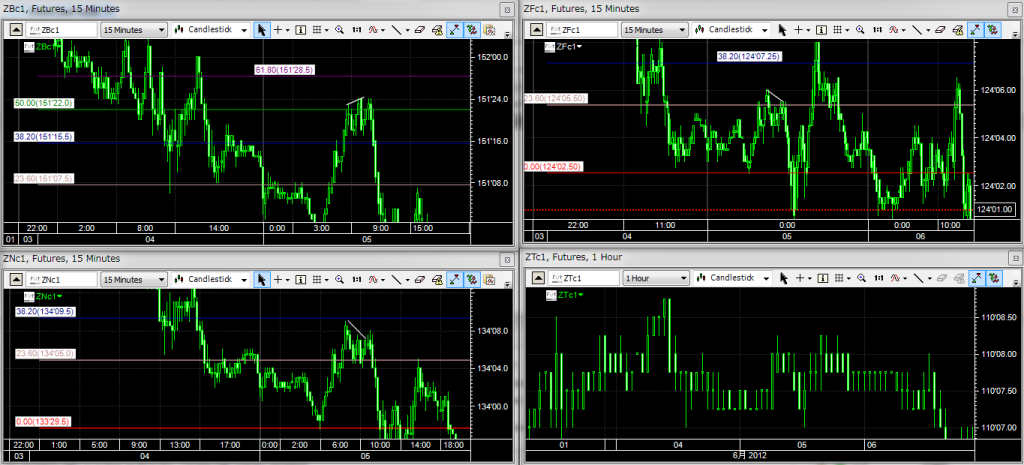
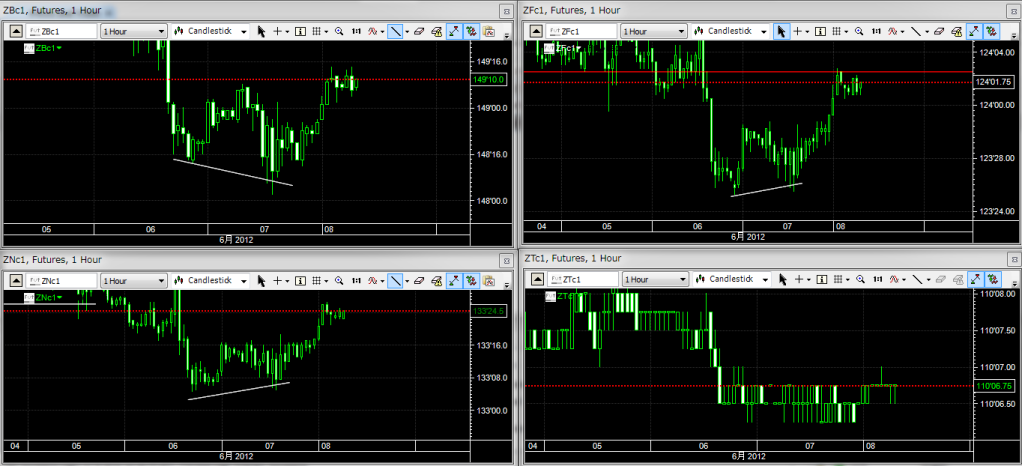
Interesting week for me following the intraday 30yr, 10yr and 5yr treasuries in the Futures market. (GLOBEX ZB, ZN, ZF contracts, not Open Outcry.) After NFP on Friday, a down day on Monday signaled a potential reversal down in the Bond market, equating to higher foreign currencies. Monday and Tuesday were still UK holidays and so focus was on the NY Open. Treasuries retraced up into the NYO where they diverged at key Fib retracements at 12:00 GMT. This confirmed the potential for higher Cable and Fiber as they also retraced into key support at LO and put in tradeable OTEs at NYO. The treasuries then put in a bullish 1hr divergence during late NYO/early LC in Thursday trading to confirm the resistance on Cable and Fiber, and set up beautiful LC trades.
Much more research needs to be done on this, but the charts are telling me that bond [B]prices[/B] are confirming moves in the currency markets.
Regards
Ali
thanks mate! very kind of you;)
scaled out a little more at +150… only 0.05 lots remaining… it’s still very hard for me to keep profits run;)
I obviously still have an incredible amount of learning to do. But it certainly is an amazing feeling to grab 140 pips and now another 150 pips, which is proofing me that it is indeed possible to achieve 3-5% a week and 15-20% a month, and it makes me believe that the decision to put all the hours, so far spent on this subject, as well as the many more hours to come, where probably worth it;)
my “trading-self-esteem” is definitely growing. However, I still have to work hard and try to maintain consistency and profitability… and then I strongly assume the additional psychological “weight”, once going live, will be smacking me around for a bit…HAHAHAHA
This week is the motivation for me to work even harder!
congrats to everyone and I hope that, if I continue working hard, I’ll someday be able to sit at the “big boys table of this thread” with you guys;)
cheers
edit: closed last portion at +198 pips wohooo! have a great weekend y’all!
Awesome stuff bro! I am definitely taking a look into this on the weekend 
Correction: 10:00 GMT on Tuesday for divergence. ZB - 30 yr. ZN - 10yr. ZF - 5yr. ZT - 2yr. (I don’t actually use ZT as it is too spotty.)
Thursday late NYO/early LC:
My feed is an offshore bank based in Luxembourg that provides brokerage services for expats. I don’t trade with them, but I bank with them and use their feeds for free. I am interested if any of you guys see this on the demo platform you were discussing at the end of last week.
Regards
Ali
I’m testing out “avaFX” and it appears their feed confirmed the USD rally. 30Y T-bonds made the lower low, but 10Y and 5Y said no way. Pop in the USD is shown Top-left…
not sure yet if AvaFX is an unlimited demo. we shall see

that said… I’m not going to be catching these kinda moves from work.
I was just looking into that earlier. And yes the demo platform feed that was discussed last week seems to be reliable. All of the divergences you discussed are evident.
It does not have the 2yr, but the 5, 10, and 30 are there.
Hey guys!
I’m going to throw a question at you which has been on my mind for some days now.
It is about the highlighted portion of the chart posted here:

Okay!
As you see, the bias was short for some days and profit taking was very easy with entering on judas swings etc.
but then of course, a retracement started to take place and if you didn’t recognise that someday this retracement will take place you would have had about 3 losses in a row and probably started revenge trading out of anger.
REMEMBER: daily bias is still DOWN, but MA’s are very expanded so alot of people will only go short and have losses.
I guess these are the most crucial ares for beginners or intermediate traders where they get wiped out / have big drawdowns.
Gladly I had only one loss of 30 pips the first day of the retracement and immediately started looking for reasons.
So, I have been thinking about what could be the best way to stay out of the market / profit from those situations.
my thoughts:
-
look at 4 hour market flow ==> okay it broke to the upside but if you trade like that you would have missed some very good entries during that trend.
-
look for higher timeframe S/R levels ==> seems a very good idea - if you check in your own charts, you will see that during that trend, price bounced off of those and made a bigger retracement INCLUDING a break of 4 h market flow
My conclusion: I will trade with the dialy TF bias (including EMA’s and daily TF marketflow) and IF price trades near a higher timeframe S/R level I will stay out of the market this day and wait if price breaks through that level (=gets back into old marketflow)
or
Price bounce off of this level and daily bias changes (= EMA’s turn around)
—> in this occasion the time you are staying out of the market will be very long
or
wait till price hits one of the EMA’s (as seen yesterday) and then start tranding again along the daily bias.
Please post your ideas and thoughts about this topic!
happy trading!
Ah cheers bro! The last time i got top shot honors i actually print screened and printed it off and have a copy on my phone and on my wall which provides good motivation in those down times :D… I’m aiming to start my own little gallery by the end of the year! lol…
That said, it seems FredFresh may have beat me to it this week, bagged an epic trade by the looks of it - awesome trade man!
I havent traded anything today at all, i spent most of the bank holiday (in Poland) doing office work for which i just finished. I worked till 3.30am, and then got up to check my charts at 6.30am and didnt see anything clear enough to make me want to put a pending order on for…
But gosh, i havent even graduated Uni yet and i already hate the working life! lol
Im done for the week now, hope you all have a good weekend, catch you all next week!
:57:
P.S. If you still haven’t taken a trade all week, dont sweat it, its a win in itself, 100% capital preserved
Theres always next week :)…
Yes I use the daily for bias - 4 hour for nearer term bias and 1hr to guage where price is trying to go. I was able to determine 1.2620 as a possible top earlier in the wk from the 1 hr - I could see the stops there.
Because my bias was down I would not trade up but rather to wait until 1.2620 and then OTE down ( mind you it does be very tempting to trade up when you feel so sure of where price is trying to reach) but I feel more comfortable going with the daily and/or 4hr bias.
I suspect that the stops are often what actually cause s/r to exist so I try to see them on the 1hr.
Nice, I like this! I have also noticed that trading is significantly more difficult when you try to catch the major turning points on the higher timeframes. For me personally, I have this problem where I try to pick out the highs and lows and I end up trading against that magical H4 market flow - suffice to say, this ends up in a loss virtually 100% of the time. It’s so very much easier to just trade with the current 4 hourly market flow and if price starts getting sticky, then stay out of the market for awhile and see what transpires.
Haha I suppose I’m writing this more for myself than anyone else  But I must say, I am just loving this learning journey, each day brings with it a new lesson!
  Slowly but surely I can see myself putting my lessons into practice and avoiding the same pitfalls. It is so true when people say that it takes a couple of years to become a successful trader, it certainly cannot happen overnight, because there are certain things one only learns through experience. Even when ICT teaches these things to us, they really hit home when you experience them first-hand.
The scariest part about trading to me is the emotional ride. It hits you hardest when you trade a live account, and it takes awhile to work through it (I’m 1 year into trading and still struggling with it!). You have to be so incredibly disciplined to be able to push the emotions aside. Nevertheless, ICT has given us the tools, the advice, and most importantly the evidence that it works.
Anyway enough of my nonsense 
Just a shout out to my boys SanJ and tycoon83 for dominating this week and last, and for everyone else who raked in some pips using ICT methods - Good on you guys!
I had to start laughing when I read
"Haha I suppose I’m writing this more for myself than anyone else But I must say, I am just loving this learning journey, each day brings a new lesson!.."
because I was just thinking the same when I wrote my post.
I guess what we both wrote about staying out of the market when price hits S/R levels or breaks 4h market structure is the key to success.
We do not have to take every trade I mean if you look at the last big trend starting at beginning of may we would have caught about 5 to 8 trades out of 10 EVEN if we stayed out at the critical points =D
Don’t forget = Pigs get slaughtered
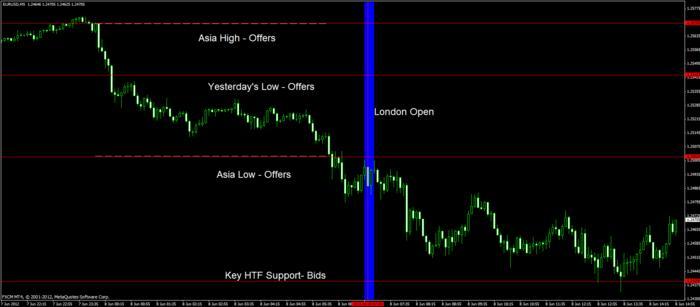
I’ve recently watched some of the old videos from last year and was inspired by ICT’s statement that we should put ourselves into the role of a market maker, trying to determine where order interest and stops are resting. Now, I analyze every morning at 07:00 AM CEST or 06:00 AM London Time, where large money orders and general stops could be laying. I use ICT’s SR concepts:
- Today’s Asia High/Low
- Previous 2 Asia Session High/Low
- Previous Day’s High/Low
- Key HTF S/R
Stops below support/above resistance. With the general bias & HTF analysis in mind and used with concepts like Judas Swing and Time of Day (LO), I found this very helpful. I do the analysis every trading day, even when I’m not trading, so I can train my eyes and create a habit for this. I find it very helpful for take profit levels and anticipating price reactions.
Things I look for after the HTF analysis:
- Based on the current market structure, what could market makers look for?
- At which price levels could the large money bids/offers be located?
- Time & Price Theory - Monday/Tuesday/Wednesday posting the weekly high/low, Tuesday/Wednesday the more favourable trading days with larger ranges.
Today’s analysis:
Initially, I was looking for the Reuters FX Buzz Data on the Oanda news feed (included in free demo, if someone is interested, but isn’t trading with them), but my goal is of course to independently identify those levels. They usually post this 1 hour before London Open and it’s surprisingly accurate, most of the time. No trading signals, just information about where important orders are resting. Anyway, here is a screenshot of their service, Reuters published the posts 07:00 AM London Time.


Im done for the week. After a terrible week in April that could only land me a hedging job at JPMorgan (or possibly making monetary policy for Greece or Spain;-), I’ve now had three profitable weeks in a row, exceeding my target 1.5% of equity. 1loss and 1 win this week, that netted a positive return of +1.7%. Am watching ICT videos and really going back and checking out fibs at various times. I can feel that the lights in the room are slowly getting brighter.
Congrats to some of the great posts / results from this week. Aside from the teaching here, which I think is unmatched , the feeling of community really adds to the fun and the learning.
top job man. :35:
Where is that news feed again?.. on mt4 demo (in the news tab), on their other platform or directly from the website?
thanks
It’s on their prop platform. Log in and click on “Launch fxTrade News”.
I like it FXTraderCro!
I actually try and go for a similar approach, in terms of trying to think like the market makers… Trying to identify swing points where stops may be laying is one of the key things in my analysis (which i also do every morning :))
One thing i also do, which you may also but just didnt mention, i also note the previous weeks and months highs and lows on my chart… Acts as a strong S/R level - usually always get a reaction them… Note last weeks high in the fiber, and then look at yesterdays price levels and where it reversed…
These concepts really can work like magic when you can tie a whole bunch of them together to make a trade…
:57:
Hey guys,
A short trading week with the bank holiday on Monday and Tuesday but it’s been fun watching.
This post is to help anyone struggling at the moment. One of the major things that has helped me with consistency is waiting for the key levels and I find my myself waiting more and more for these levels because i’m noticing that they work!!
Support N Resisance has been beaten to death but i wanted to post up a chart for both the Cable and Fiber with the support and resisance lines I had marked from a while back. I’m sure you had these levels marked too…
Cable
1.5600
1.5340
1.5270
Fiber
1.2600
1.2450
1.2330
If you just took trades at these levels you would be quids in this week!
i’m a little bit disappointed that I missed my trade that I mention earlier this week, for a sell at 1.5600 for the Cable either at NYO or there was a OTE after at LC (late) which I could have used to get in, the truth is I expected it to happen the next day and it caught me by surprise, never mind, plenty more to come.
A Picture says a thousand.........
how sweet is this!!!..Keeping it SIMPLE


That is awesome tycoon, we should all take note…
This is to me one of the most invaluable lessons learned from ICT. I’ve noticed many, many times how the banks push price to take stops on one of the crosses (hence smt divergence at key s/r levels) - often this push is against 4 hr bias, stops taken and then trend resumes.
ICT says that they leave ‘elephant prints’ so lately I’m hunting those elephants