Thank you Sinn1, BrianSNJ, Ray_1 and Kenneth Lee for your continuing support. 
[B]Right, back to my proposed ultimate candlestick trading method.[/B]
Look and study the following 5 minute chart of an evening star >>>

By tymen1 at 2008-06-07
This chart has the same format as the previous one.
Our short entry with 1 amount turned into a “retrace first” trade and was closed at -10 pips.
Note that we [U]did not persist further[/U] in this chart or the previous chart with this entry.
Before, we would keep this entry, find the top of the retrace and add a 2nd amount with the computer averaging the entry.
[U]Now [/U]we examine this short entry, find it to be going the wrong way and hence close it.
Remember that hyperlink I posted for reading just a little earlier.
Did you read it - here it is again.
The Starc band is now going up and, by definition, we look for the retrace top as the price action goes thro the Starc band. Preferably we should wait for a walk up the upper band for about 3 candles but the 2nd candle is red and no higher than the first. This green candle before it is also very extreme and passes thro the upper BB.
It will do for the purposes of illustration.
2 amounts, and again an exit when passing thro the lower Starc.
This gives 2 amounts of +17 pips = [U]34 pips.[/U]
The next trade is for experts only. The Starc band is now going down and a tag or near the top of the upper Starc is called for. The retrace does not do these things - instead it is a reaction from passing thro the lower Starc earlier.
I shall leave this amount out for now.
The next trade is a classic retrace/exit and follows the same rules as before with 2 amounts.
This gives 2 amounts of +20 pips = [U]40 pips[/U].
Grand total is 64-spreads ie 64-6 (3 pips per trade) = [B]58 pips.[/B]
This chart was taken from an earlier trade shown on this thread, and, if I remember rightly, the stop loss was at 90.
Entry at 66. Risk is 90-66 = 24 pips.
So risk/reward ratio is 24 : 58 which is 1 : 2.4 which is good.
[B]I have now to present a picture to show what I am driving at.[/B]
[B]Tomorrow!![/B]
[B]Before I embark on showing you the new method - it is time again for …yes…exercises![/B]
[B]EXERCISE 4[/B]
Look at the following 5 minute chart of an evening star trade >>>

By tymen1 at 2008-06-11
The short entry is shown by the black vertical line. After this candles are numbered 1 to 16.
-
Which number (s) would you consider to be a retrace point (s) ?
-
Give reasons for your answer (s).
-
Which number(s) would you consider to be an exit point (s)?
-
Give reasons for your answer(s).
[B]EXERCISE 5[/B]
Look at the following 5 minute chart >>>

By tymen1 at 2008-06-11
This is a chart of an evening star trade and candle S is the “star”.
A stop loss (red dashed line), is set just above this candle.
Short entry is made at the black vertical line.
-
What is special about candle R?
-
Does the top of candle R qualify as a retracement point? If so, why and if not, why not?
-
If your answer to question 2 was yes, then how would you avoid the subsequent action of hitting the stop loss in candles A and B?
-
If your answer to question 2 was no, then what would you have done with the initial entry at the black vertical line?
[B]Answers to exercises 4+5 after several posts of attempts at answers! [/B]
My answer to Exercise 4:
[B]First retrace point[/B] would be at top of ‘2’… this is because STARC bands are going down so the top of retrace is usually at middle of STARC band. (I would sell a 2nd amount at this point).
[B]**** edit****[/B] - as in my answer to Exercise 5, I actually wouldn’t have entered at candle ‘2’ as I would have waited for the price to [U]‘walk the band’ for 2-3 candles[/U]… I more likely would have entered at close of candle ‘5’. However, at the time, I would have been looking for a retrace point around the middle STARC band as the bands were moving down… entering above the middle band would have been an extra bonus.
[B]First exit[/B] would be half way down ‘7’ when the price cuts the lower STARC band, or at 10pips+spread (whichever comes first).
[B]Second exit[/B] possibly at ‘8’ when price cuts lower bollinger band.
[B]Second retrace[/B] is at ‘10’/‘11’… this is because STARC bands are going down again so top of pullback usually at middle STARC band. I would sell 1 amount here.
[B]Third exit[/B] would be when bar ‘12’ crosses below lower STARC band and lower BB.
Because the price ‘closed’ below the lower BB and there’s a STRONG piercing pattern at bar ‘13’, I probably would not look for anymore retraces after that point.
My answer to Exercise 5:
What’s special about candle R - its BIGGG. It has very tiny shadows which shows a weakness in the sellers. It also crosses the middle bb, the middle starc and the upper starc, which is a lot to cross and shows buyers are strong.
Top of candle R does not count as a retracement point as Tymen recommends to wait for 2-3 candles to form that ‘walk the upper STARC band’ before another amount is opened.
The second candle therefore would have stopped us out of the trade.
The initial entry would hav given us a loss according to where the stoploss was placed… BUT… looking at Tymens 2 previous lessons, he shows that the the initial entry is closed as soon as it reaches -10pips, even if another amount is opened at the retrace point. I personally would have lost the whole amount (up to the stoploss) as I am still using Tymens previous MM strategy without the ‘-10pip -first-entry-stoploss’. Maybe this is what Tymen will talk about next.
[B]Ok, more answers needed!![/B]
Then I will give the correct anwers.
Please do not be afraid to post your answers even if they are wrong!
I notice that the viewer count has come to an almost standstill.
This worries me - are people still looking at this thread ???
[B]If not then it is time to close this thread prematurely. [/B] :eek: :eek: :eek:
Hi Tymen,
Here’s my take on the exercises;
-
I see candle 3 as the first retrace because it goes thru the top KC. Probably add to posn after candle 4. Candle 8 could be an exit as it goes thru bottom BB. Candle 11 could signal a pending turn and candle 12 is the turn down, but it probably happened so fast I probably would have missed it, so likely not a trade (depends on speed of candle).
-
Candle R is strong as it goes thru both the middle and top KC. I would just cut my loss on that one.
Please keep the thread going. I am still following along with interest, as are many others I’m sure.
[QUOTE=tymen1;52621[B]If not then it is time to close this thread prematurely. [/B] :eek: [/QUOTE]
NOOOOOoooooooo!!! :eek: :eek: :eek:
Exercise #4
(1) 3,4 3 touches upper KC band. But 4 opens and continues up. Would enter when 4 started down… 10,11 Same as above but Middle KC band.
Safer entry would be 3 and 10 but it continues up in both cases. So would enter on 4 and 11. If opened going down would enter straight away.
(3) 8 Hit bottom BB band But opened going down would have closed when it started to reverse . 13 line 12 was a fast down swing went way pass bottom BB. Would have closed when 13 started up, it opened did not make any new low and then headed up.3
Execrise #5
I don’t like the initial entry point black line seems late… But the long green candle is very bullish looking would have closed and taken loss on that entry.
If this star was initially spotted on a 20 min chart might have entered top of 5th (greencandle) from the star and exited 9th (red candle) from the star…
That is my take… Please keep up the great work. I am here 3 -4 time a day… I need to reread the whole thread seem to be lacking on some things…
I don’t have answers yet because I am stuck working round the clock last minute for a client emergency.
I think 1 big reason ‘viewer’ count of this thread might be down because of the length and clutter of the thread.
I think 2 things are needed -
1- Consolidation. A clear list of the system, the rules, etc. I find myself re-reading the old material out of confusion. This thread is wonderful but certainly has become a winding twisting road to follow. lol
2 - I wish the moderators would allow you to create a blog page for this system and set it up like the Cowabunga System is.
So You’ve Finished The School Of Pipsology…Now What? | Forex Blog: Pip My System
A nice, clean easy to read page with the system’s rules, then another area for discussion, trade logs, etc.
You have certainly done contribution above and beyond just commenting and offering quick advice. You have posted CUSTOM screen shots!!! That takes a ton of time and effort. Each one of those is worth 3 or 4 regular posts in my opinion. If this thread dies or ends prematurely, it would kill me. I really mean that. I have invested a lot of time, ignoring my girlfriend, nights out, getting behind on laundry, etc just to learn patterns, read this thread, because YES, it is that important. This is SOLID GOLD!!! I cannot believe the kindness of Tymen.
SO, guys reading this, do you see the tiny gold colored THUMBS UP/DOWN icon at the top right of TYMEN’s posts? This is a reputation builder. Click on it and give TYMEN some positive rep for all he has done. CLICK OFTEN!
OK, I apologize if I was blathering on and on. I needed to get that off my chest.
Your teachings have changed the way i trade in that now i am making profits although small, its a step in the right direction.
here are my answers to the exercise’s
ex 4,
-
points 3,4,11
-
the starc bands was going down and price action tugged the upper band for points 3 and 4.for point 11 prices action comes near the upper band.
-
points 7,8,12
-
price action goes through the starc band.
ex 5,
-
it confirms that the trade is a retrace first,and i would exit at -10pips and wait to enter at retracement point.
-
it does not qualify as a retracement point since both the starc bands and the mid bb are both heading up…to get retracement point wait for 3/4 candles as price action walks the upper band.
-
i would exit at -10 pips
Please do not end the thread!!!
My wife says i am going crazy!
She says it cant be done, and this is all a big con, i am fighting battles on many fronts, she is waiting to see profits…
Tymen your teachings are brilliant and the best there is in the WholeWideWeb and i’m there waiting and reeading every post.
I went live with GFT, kinetics, and although my demo account had all the study options available, my live account ‘turned off’, or didnt allow me the option of many of the studies (no starc bands), i found myself just using bollinger bands to determine retraces, and just assuming the band direction depending on recent price action…i have not been successfull, definately i am still raw…and trying to get myself up off the ground…very hard to start at the bottom, sometimes i feel like giving up, sometimes i am not sure it is possible
I do understand your methods, but in real time it isnt working for me. I find i am too keen for the evening star, and i have been treating the morning star as though all the same principles in reverse will work…(is that ok?)
I HAVE ALSO BEEN TRADING TOO MUCH, nearly 24/7… i am determined…possessed…and unsuccessfull
I am successful in the beginning of the day when i am patient and fresh and seem to do really well. My confidence/greed grows and then i blow it all later in the day, and i end my day in trades i cant get out of.
I have also often entered trades before the pattern was complete (ie. the third candle wasn’t closed), only to see that the pattern on completion didnt look like an evening star any more.
I have also entered evening star patterns (or dubious patterns) after strongish up trends, only to see the trend go down slightly and continue up and then i would double up thinking it was retracing and about to go down. I clearly need more practice. I am doubting myself, the pattern appears but if it is on the upper trumpeting band it is not valid, if it is not perfect it is not valid, if it doesnt touch the upper band it is not valid and sometimes it occurs in the middle and goes down…i am unsure i will make it to success.
I have also often looked back through the charts and many good patterns dont seem to be making so many pips (sometime less than 10 pips). Often i have seen that it take two patterns to form for the price to go down. My confidence is gone.
Can you show us what happens when things go wrong? How to minimilize loses (i know stop loss), but when trading things happen quick, ie. enter trade, then straight away -4,-5,-6, pips… then we are setting stop loss, sometimes stop loss can be -30, 3 pips on top of evening star or -15 depending on the height of the candle is there an optimum stop loss for a learner traders, who make mistakes, and arent pefect.
I have also discovered patterns a little late only to see the price going down and i enter… always seems to be at the bottom, and then the price goes up(perhaps i should just reverse all my decision making - ie. make my decision, then do the opposite)
I do like the option now given to exit once the price retraces, although, i am unsure when to reenter, or to exit. Is it when the price retraces to -10 pips or does it have to go through upper starc band, and then we re enter once it hits the upper bolinger band?
Often once the third candle completes the price suddenly goes down four pips…so quick i get in (missed out on 4 pips), only to see it then go up, so the -5 pips from open price of the candle is now -9 pips. Things are happening quickly and slowly and decisions are made not on a frozen in time screen, where we would get the ideal entry/exit.
I am unsure how many pips aim for, or should there be a target or just play the 5 minute chart and starc band to see how we go.
You are helping tremodously Tymen, but i am not there yet.
I was going to maybe suggest our class perhaps post some trades they have completed. Maybe just post the currency and time (only post times as 0+gmt) enter price exit etc.(dont need post chart). We can see how we do, whether or not success or not.) i am very interested in the ones that stop out too, and all the imperfections of the trade. Learn from our mistakes…hopefully
Thanks again Tymen please continue
You are nowhere near ready to trade live my friend. Please return to demo immediately. Remember that trading can be done but for the vast majority your wife is right in that success is not possible

Tymen,
Could you please explain more about the entries you have posted in this image. The 2nd entry has not ‘walked the upper band’… a more likely entry (in real time not in hindsight) would have been 2 candles after this point at the open when the price begins to fall down into the Bollinger bands.
The third entry’s candle also did not ‘walk the upper starc band’… how would you know if this candle is good to enter on? In real time it would probably be unwise to enter on this candle (based on the rules of your system) because there is no clear entry point.
The fourth entry also does not walk the upper band… it doesn’t look like it touches it and the candle before it also does not touch the upper starc band… a more likely entry (in real time trading) would probably have been mid-way through that candle.
I’m not saying it’s impossible for YOU to enter at these points as you have the experience behind you… I just wanted to know if you can elaborate on your entries because based on the advice you gave in previous posts these entries are not valid, especially in real-time trading (non-hindsight).
I also wanted to ask where the stoploss would be for the 3rd and 4th entries. In previous lessons, you said to move the stop loss to break-even after the price of the second entry has passed it. But for the 3rd and 4th entries the price has retraced back above this break even point so a different stoploss is needed. Would you go back to the initial stoploss above the evening star?
I attempted a trade earlier today which is shown below:
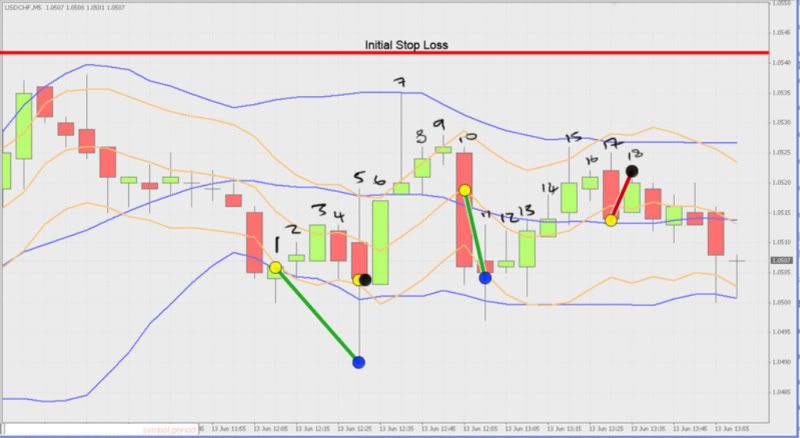
Yellow cirlces show entries
Blue show exits with profit
Black shows exits with loss/breakeven.
This shows an entry at candle ‘1’… a retrace that 'walked the middle starc band for 2 candles before hitting the upper starc band. I entered a 2nd amount half way down candle 5 as i was slow to react…
The price went below my BE point and i moved my stoploss to BE. One amount closed at 10pips, the second amount closed at BE.
(good so far in my opinion, bar the late entry after the retrace)
The price then retraced again and walked the upper starc band for a good 4 candles… the price then shot down at candle 10 and I only managed to enter 1 amount half way down it. This then closed with 12 pips profit at close of candle 11.
**** Where would you advise to put a stoploss on that entry (seeing as it retraced above my BE point)?***
The price then retraced, hit the upper starc band and fell sharply at candle 17… i entered at the bottom of 17, thinking the price would continue to go down… I put a stoploss 10pips above the entry point.
The stoploss got hit… but the price reversed AS SOON AS IT HIT MY STOPLOSS, kicking me out of a good profit at the low of candle 22.
Basically…
How do we judge the stoploss of the 3rd and 4th entries?
Sometimes the price ‘walks the bands’ sometimes it doesnt… it’s impossible to get the top of a retrace in realtime trading but how have you judged your entry points in your previous lesson where the price did not walk the upper band?
Overall the system is working great Tymen. I appreciate the work you put in to teaching us this. I have learned a lot and now I think its just a case of tweaking my understanding of price movement to get better entry points and stoploss points for retrace entries.
The trade above should have given me well over 45 pips profit if I:
- Wasn’t too greedy on the 2nd entry.
- Judged my entry price for 2nd, 3rd and 4th entry better.
- Judged the stoploss for the 4th entry better.
I hope I havn’t given you too much work reading over this long post! Your feedback would be greatly appreciated.
Thanks again Tymen for the quality input you have already given!
Thank you so much, Tonymand, for taking this matter in hand and giving a decisive answer in such few words.
Great to see that you are still reading this thread!!
Our weather has done a snap freeze now - about time, it is winter. Nothing like a woolly cat sleeping on your bed as a foot warmer!!
And we are actually getting rain!!
On the 21st of this month we will have the winter solstice, the shortest day of the year.
Maybe a good day for shorting trades!
The post by Trav72 totally overwhelmed me and I did not know where to even begin to answer!
To Trav72 I say :
[B]Take note of Tonymand’s answer and do exactly what he says.
He has the highest ranking on this forum (FX Honourary Member status) and knows what he is talking about.[/B]
[B]I will now answer the post by Sinn1 in detail, hoping that all readers will gain from it. [/B]
After this,answers to the exercises 4+5.
Then new material.
[U]Now to answer Sinn1 :[/U]
Knowledge is power.
You have knowledge but lack the detail that is required.
Did you do exercise 3?
Did any readers do exercise 3?
Therein lies the problem.
Exercise 3 was a colouring in exercise using Microsoft Paint. This would have appeared to be a silly exercise to readers - indeed there are no reply posts to it.
[U]And yet it was probably the most important of all the exercises!![/U]
Colouring in exercises are for :
- Kindergarten and primary schoolers.
- Forex candlestick traders.
By doing this exercise several times from different trades, you will gain an insight into how Starc and Keltner bands operate together with Bollinger bands. No words can describe the insight you gain - it is a thing you must do!
Did you do the exercise?
If not, then go ahead and do it. It is post number #514 on page 52.
Do it several times on different trades.
Use “large size” on “view” and [U]do not miss a single pixel![/U]
Make sure your work is 100% accurate.
It will take you more than 1 hour to do one properly.
Several pictures will take several hours.
It is time extremely well spent and will teach you much bettter than any words can.
[U]All readers should do this exercise.[/U]
[B]When you have completed this work, the answers to your questions should become self-evident!
That is, you will be able to answer your own questions!
I know it sounds silly, but then I am a retired school teacher, and know that sometimes silly exercises are very profound! 
Do you remember watching a film called the “Karate Kid” where the Chinese master taught the pupil Karate strokes by getting him to “paint the fence” ?[/B]
If you still cannot see the answers after doing the exercise, then I will answer direct. I have recorded your post number #575 page 58.
Hi Tymen,
Thanks for your reply. I hope you didn’t think i was being negative about your system or your lessons. I think they have all been extremely valuable.
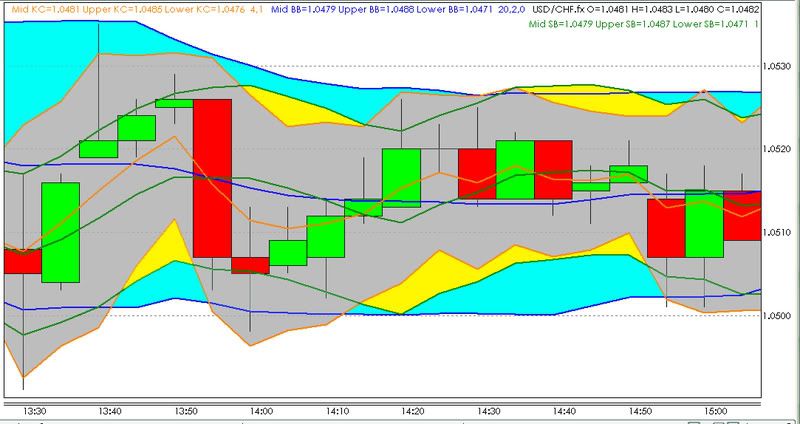
I had a go at colouring a small section of the USDCHF chart. I used the same section that I tried to trade earlier.
I only used a small segment of the chart but I think I can see what you’re getting at.
I will try again with a few more charts with larger sections to prove what i’m thinking. Then I will attempt to explain it and wait for your feedback.
It does actually look quite interesting. Will have to think more about what it all means.
Now the answers to Exercise 4:
[B]I would invite all readers to compare their answers carefully. It is in this comparison that you learn. [/B] :o :o 
-
Top of candle 3 and top of candle 12.
-
The Starc band is going down so, by definition, the price action can go near or merely touch the upper band for a retrace.
In candle 3, it was indeed a touch. Candle 4 is higher but, seeing the Starc is down, you would not know about 4, and since 3 meets the criteria, thats where you would add a 2nd amount.
In candle 11 you would still be looking for a touch. With no touch, we meet candle 12 and this is closer to the Starc. We enter as close to the top as we can.
Note that these are the theoretical tops. It is rare to get the actual top, but rather to get as close as you can.
[U]Using a 1 minute chart (do not close the 5 minute chart!) aids in getting closer to the theoretical top. Have a 1 minute chart ready to toggle to.[/U]
-
Bottom of candle 8 and the bottom of candle 12.
-
Tagging or passing thro the Starc bands shows extremes. There is added confirmation when there is also tagging/penetration of the Bollinger bands as well.
Now the Starc bands are going down at candle 7 which is an extreme but with the bands going down, we look for a walking of the bands, just like the price action does with the BB.
So we are not satisfied with candle 7, but candle 8 is a super extreme and passes thro both the lower Starc and lower BB.
Here we exit.
Candle 12 is amazing. The bottom is a super extreme passing thro both the lower Starc and BB. This is an excellent exit.
[B][U]Extra Notes[/U][/B]
When finding a retrace, 2 separate scenarios apply.
[U]1) Starc going up.[/U]
Price action must go thro the upper Starc, not just tag it.
Price action walks the upper band.
Therefore it is good not to jump at the first price action that crosses the band but wait for 3 candles unless the candle is a super extreme. Then an immediate entry is fine.
[U]2) Starc going down.[/U]
Price action may go near or even tag the upper Starc.
No waiting - when we see this we enter the 2nd amount.
When finding an exit, 2 separate scenarios apply.
[U]1) Starc going up.[/U]
A touch or very near the lower Starc means an exit.
[U]2) Starc going down.[/U]
Price action must go thro the lower Starc, not just tag it.
Price action walks the lower band.
Therefore it is good not to jump at the first price action that crosses the band but wait for 3 candles unless the candle is a super extreme. Then an immediate exit is fine.
If you do not get the exact top in a retrace, do not dispair. You can make up for it with a good exit.
The better exit you make, the more it compensates for a bad retrace entry.
It is now 2 am in the morning here. My cat is asleep on my bed and I am going to do the same.
[B]Rest of work tomorrow.[/B]
[B]Answers to Exercise 5, page 57.[/B]
-
Special about R. It passes thro the upper Starc band whereas all the prevous 13 candles have not done so.
-
Retracement point? - NO!
The Starc bands are going up and prices will walk the band. Higher prices can be expected. -
Not applicable.
-
Nothing can be done!! We watch the prices rise hoping that a retracement will occur just below the stop loss!
[U]It was not to be[/U] as the price action passed thro our stop loss and hence we lose this trade.
If you closed the trade at -10 pips (candle R) because you expect the trade to go wrong, then you miss out on the possibility of adding the 2nd amount if a retrace does occur. You would sabotage your trade.
[B]However, improvements to this method are to come[/B]!