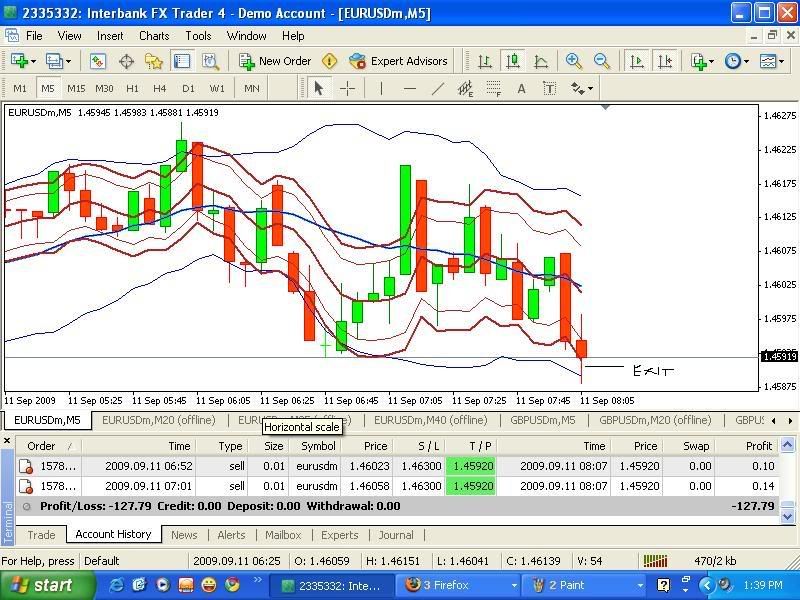
This is where the trade was exited
Finally, a look at main chart after exit. The Rectangular box shows the pattern based on which the trade was taken. The big oval shows the overall play till profit was reached. One thing about this trade is, when the pattern formed on the main chart, the 3rd candle was already hitting middle bb (Should I have taken this trade in the first place ???) I need some clarification on this. Another question that came to me is, say when the pattern is formed on the main chart and when i switch to 5min and find candles already breaching or very close to lower starc/lower bb (in case of SHORT patterns), can i still take the trade hoping price to still go down if the middle bb on 5 min is bent deep down ? Hope Tymen can clarify. I also welcome comments from other members to improve our trades.
Regards,
Muthu,
Chennai India.
Hi,
I took eu short (17:41 & 17:48 GMT) just after midnight my time. The 3rd candle in the pattern was all red and just in the closing moments of the candle its body shrunk. Nevertheless, i took the trade.
Ok, now for the final post of the trade. A look at how the main chart came up. The smaller box is the pattern on which the trade was based. The bigger box shows the over all play of the trade. I hope my attachments are visible to people. Comments, criticisms and suggestions are most welcome.
Regards,
Muthu,
Chennai India.
I muthusai2000,
I think your second trade (EUR/USD) is a risky one. I think this is not a really good evening star pattern, the body of the 3rd candle is not long enough, it should close at least halfway the first candle, and the bottom wick is longer than the body (meaning that there is some buying pressure). Plus, when you enter, the mid BB is going up.
However, well done 
(I may be wrong, this is just my thought ;))
I am very happy for your recent success! The candle stick patterns on the main charts you’ve posted don’t scream TRADE THIS PATTERN, so I would be careful moving forward.
Let’s review some of the patterns posted by Tymen1:


These all scream TRADE THIS PATTERN to me.
Also, I’m not sure what went wrong with imageshack, but you should try it again. It is very difficult to follow along when the images are attachments.
This strategy requires reviewing many charts all at once. Many posters here have mentioned they have 60+ or even 80+ charts open simultaneously :eek:
I have a humble 48 charts open, which I can review in a few seconds with MT4.

I’m using Oanda for my trading, but am debating moving to GFT after the compliments I’ve seen in this thread. How are you GFT users handling the large amount of simultaneous charts? I have the demo right now and I’m having trouble replicating my setup above.
On the GFT Demo I have one workspace with the 20minute chart for each pair, and if I see something favorable I jump to a workspace dedicated to that pair for further review. Is this the best way?
Note: My monitor is bigger than the screenshot above, I have no problem reviewing the charts at this size.
Edit: I’m using multiple MT4 demos for my setup above, then minimizing each screen with a desktop effect in Linux. Obviously I cannot replicate this exactly with 1 GFT account, but I’m looking for a reasonable alternative.
Today’s trade.
Here was the main chart.

I traded both short patterns.

I explained the trades and my thought process in this video
I am trying to keep 3 charts open for each pair, 60m 30m 15m – do you initiate trades based on patterns, regardless of the time-frame? If you only initiate trades from one chart, which time period is it? I’m still not sure why everyone is opening quite so many charts.
Dodge:
Enjoyed your youtube video. Rated it with 5 stars. On the 20 m chart it is good you didn’t enter on the first pattern. Remember when the bb is is trumpeting and in a strong up trend as in this case, according to tymen, it is always good to wait for a second confirmation pattern which is what has happened here and you shorted the second pattern. We also see another good pattern formed on 25m (I assume when the second pattern formed on 20m). Good luck with the trade you are holding. Keep those youtube videos flowing in. As they say “a candle loses nothing by lighting another” Just my humble opinion and thank you for your feedbacks on my trades.
Regards,
Muthu.
Chennai
India.
Hi,
Yes trade is done regardless of time frames. However looks like it is better to look for trades from 20m upwards. The reason why people open many charts is that we get some good opportunities and we can trade the best patterns. I have 7 pairs open and with 4 time frames per pair (20, 25 30, 40) which means i look at 28 charts. More trading opportunities and i can select quality patterns out of them.
Regards,
Muthu.
To [B]muthusai2000[/B] :
Back just quickly between trading.
Forget Image shack - they are tempermental.
[B]The solution[/B] : go to [U]Photobucket - Video and Image Hosting.[/U]
That image server is much better quality in my opinion.
Spend half an hour familiarising yourself with the site and how it works.
Set up images for a 17 inch monitor and remove all ticks.
You will then get the big charts that [B]DodgeV83[/B], [B]Jack B Pip[/B] and me have been posting.
I will show you some screen shots to help you on Monday, but I am trading just now.
I watched that u tube video too - it was excellent.
Congratulations to [B]DodgeV83 [/B]for the successful trade and for the video production.
Silly me, only now did I remember to copy/paste the URL into the u tube downloader. (it works!!  )
)
Now all I need to know is how to make those u tube videos myself and I can post them on the forum!!
I take it that you need some special equipment to do it.
Arrrh - it is pouring rain outside, my washing is on the line and my super furry, ginger cat, [B]Sweetie[/B], has just decided to sleep on my lap whilst I am trading!! 


Tymen:
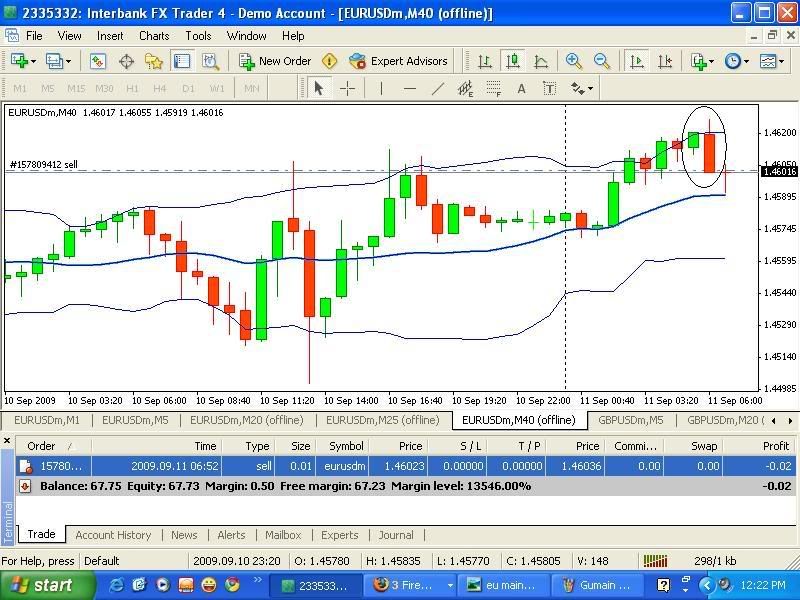
Thank you for the tip. I am trying to familiarize with photo bucket. Ok now for this new trade. Its a bearing engulf pattern (thats how i saw it when i took the trade  I traded two lots and i entered the second lot at a better price here only the first entry is shown as i took the screen shot as soon i spotted the pattern and entered. I hope people can see my image this time.
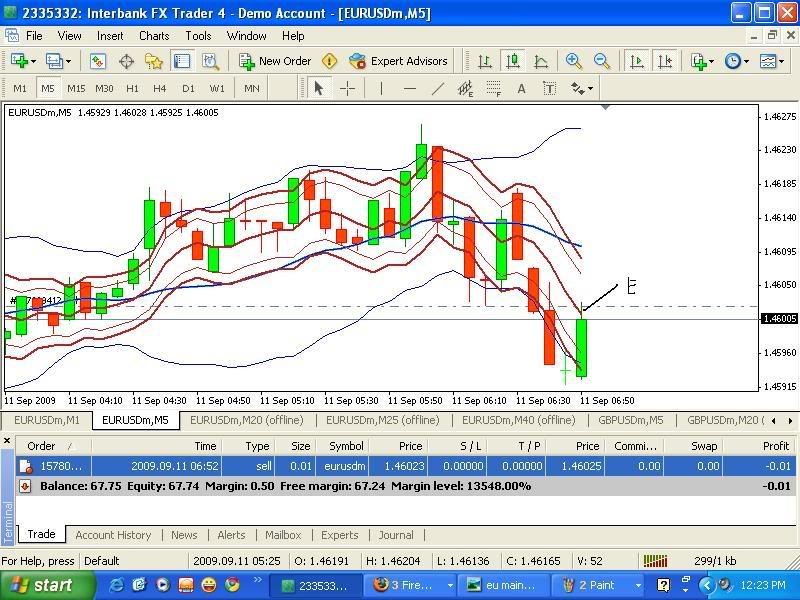
Here is the post of 5m entry. It only shows the first lot entry. I took the second one as well few minutes later.
This is where both lots were exited. The second lot was entered at 1.4605 @ 07:01 gmt. First lot at 1.4602 @ 06:52 gmt.
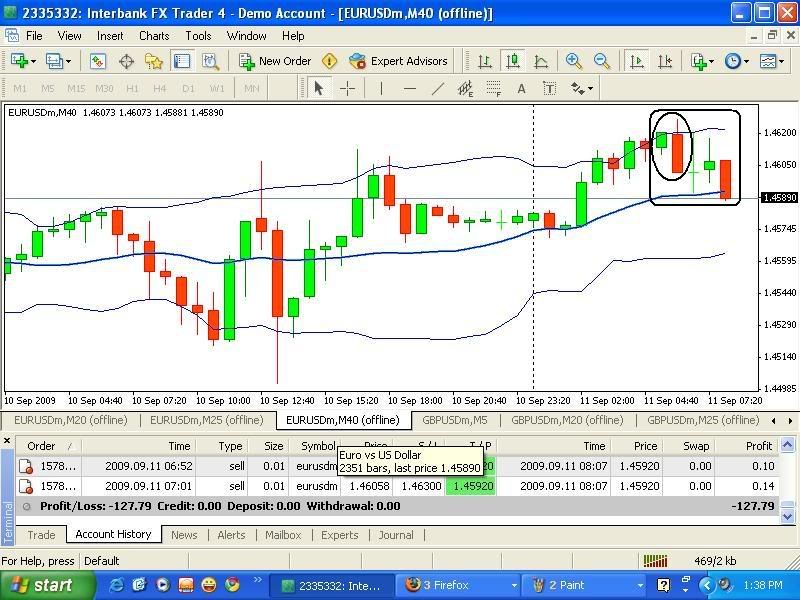
This is how the main chart looked after exit. The oval shows the pattern based on which the trade was made. The bigger box shows the over all play of this trade. I hope this time my charts stay. Comments are most welcome.
Regards,
Muthu,
Chennai India.
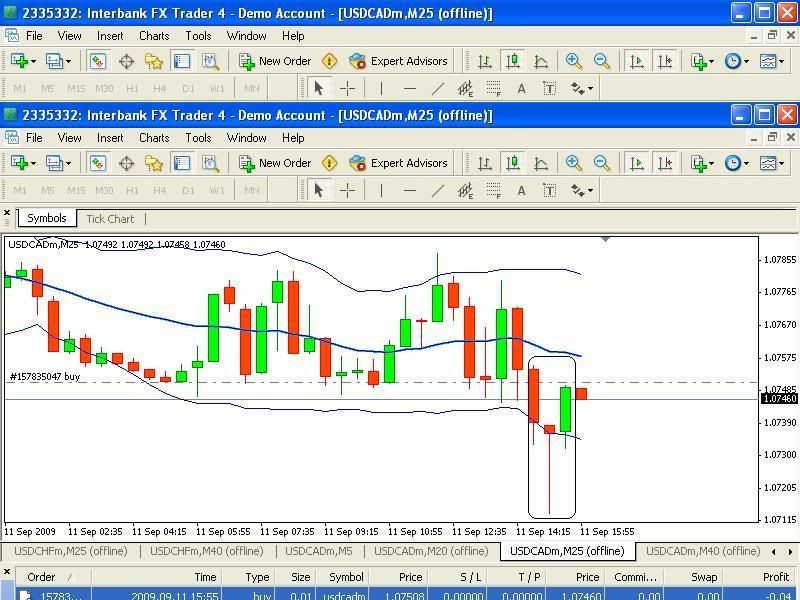
At last, I managed to spot a long trade. Although again it didnt look like text book pattern, nevertheless i took it. I also apologize i could not grab 5 minute entry and exit my 2 yr old daughter got naughty and started playing with the keyboard.
Time of trade 15:55 & 16:00 GMT. I entered two lots. The dotted line shows my first entry.
Here goes the main chart at entry
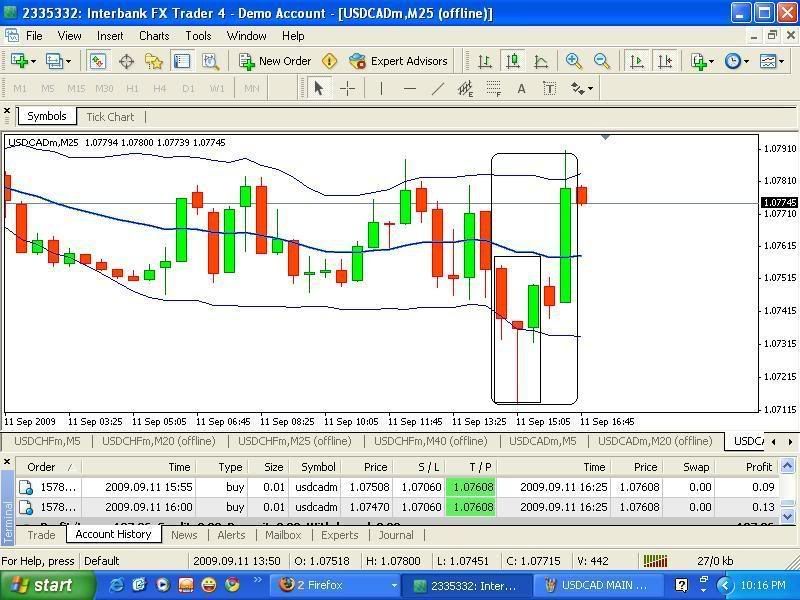
This is the chart showing exit. The play was quick compared to the last trades. So far i am keeping a target of ten pips for all my trades. I must try to see if i can take the ride when it happens, as it did in this trade…The pips achieved is shown in the bottom of the chart. I am playing with a demo account trading 1 cent per pip.
The pattern is shown in the small box while the over all play is in the bigger box.
Comments are most welcome.
Regards,
Muthu.
Chennai, India.


