THE JOY OF CANDLESTICK TRADING - Part 2

The drawings here are of sufficient quality to be used in the final PDF.

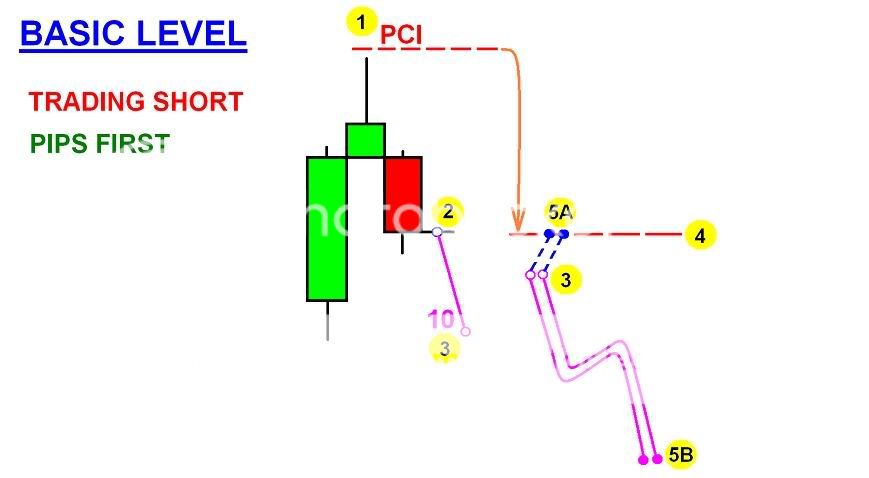
Basic Level - Short trade - Strategy B -Pips first.

Full Explanation.

Here an evening star is used as an example showing a short trade.

This is a pips first trade - here the price action goes in your favour immediately.
The method is the same for all short candlestick patterns.

The numbers indicate the stages in executing the trade.
Blue lines/circles are negative positions, magenta lines/circles are positive positions.

  1. Set the PCI stop loss about 3 pips above the star. Please allow for the spread.

  2. We enter with only one amount once the new candle starts.

  3. When the price action has gone in our favour by 10 pips, we enter the 2nd amount.

3 continued) Here we see 2 pink circles where the computer has averaged the 2 short entries.

  1. The PCI is moved to break even.

5A) If the price action goes back to this line, we will lose 5 pips on each amount
making a total of 10 pips lost.
We will then call this a lost trade.
However, the loss is small, being only 10 pips.

5B) If the price action does not go back to the PCI (we hope it does not), then we set a good profit target for both amounts.
We exit both amounts when this profit target is reached.

This is Strategy B for a pips first trade.

By using the multiple amount approach, we improve the risk/reward ratio.
(In strategy A, we improve the win/loss ratio).

By entering one amount first, then delaying the 2nd amount, we use the clever tactic of getting a target profit with 2 amounts.
If, however, the trade loses, we again use the break even approach and lose with only one amount.
Thus the risk/reward ratio is improved.

The same strategy and approach is used for a long trade.
Both these methods used in the Basic level are slightly different, but accomplish the same thing - to get more profit and less of loss.

Strategy A improves the [U]win/loss ratio [/U]while Stategy B improves the [U]risk/reward ratio.[/U]

If the [U]BB rules[/U] are carefully obeyed and the [U]candlestick patterns [/U]carefully chosen then losses will be few.
However, when they do occur, you can be confident that the above strategies will generate more winning pips in the winners, and less losing pips in the losers.

[B]So the end result is that you continue to make profits.[/B] :slight_smile: :slight_smile:

[B]I will do a similar treatment of the Advanced level shortly.[/B] :slight_smile: :wink:

Tymen,
When looking for a reversal pattern on our main chart (25m or 30m) should we look for patterns that will move the same direction of the trend on a higher time frame like the 4h or daily charts? Or does it matter?
Thanks
Jack

Tymen,
On the basic method, what time frame is best to use?
Thanks
Jack

NO!!

Do not use an extra chart with this method.

All you will get is confusion.
We aim to eliminate that here. :slight_smile:

The timeframes I have set up for this method are from 20 minutes to 1 hour.
However, there is nothing to stop you from using higher time frames.

The only problem with higher timeframes is that you will have to wait very much longer for a candlestick pattern to appear.

The method is now developed to such a level of sophistication that trading is not improved by using a longer timeframe.

The short timeframe approach is aimed at getting your money today rather than tomorrow!! :smiley: :smiley: :smiley:

The same timeframes are used for both the [B]Basic [/B]and [B]Advanced [/B]levels.

Here is a wonderful USD/CHF trade I encountered with an evening star/short engulfing pattern.

The trade starts immediately on the 5 minute chart with the black line being the first candle after the pattern >>>

Note the following…

  1. The mid BB has gone level - minimum needed for short entry. The mid BB was expected to go down, which it did.

  2. The starc bands are level at the entry point - therefore, the correct short entry for the 1st amount is the upper 0.7 band.

  3. The 2nd entry would probably not get as good an entry - but good enough.

  4. The upper 0.7 short entry is at 672

  5. The trade normally would be exited at the lower starc band. However, in this case we are on a roll downhill. We therefore, do not exit but wait instead to see ourselves getting much profit!! :smiley:

  6. We will exit when the starc bands re-enter the BB and turn around (upwards).

The trade continues >>>

Note the following…

  1. The starc bands are level till about point A.

  2. The mid BB has turned down, which is what we want for a short trade.

  3. The starc bands are screaming downwards and the profits are roaring in!! :smiley:

Chart 3 >>>

We have a green candle at the bottom.
Shall we exit?

NO!!

The mid BB is going down strongly.
The starc bands are still going down.

Chart 4 >>>

Note the following…

  1. The outer BB have expanded greatly and the starc bands are walking the lower BB.

  2. The price action is walking the lower BB.

  3. The mid BB is going down.

  4. We are making great profits - The entry was for 2 amounts at 672
    We are now at 600
    That is 2 amounts of 72 pips = 144 pips so far!!

Chart 5

Here is the main chart >>>

This pattern is a combination of evening star and short engulfing pattern.
This is an advanced choice and not one I would recommend for the first time user.

I used several of the 20, 25, 30… minute charts to confirm that this was a good pattern.
The main chart above is a 30 minute chart.

Note the huge red candles following the pattern - looks like it may have been a news release!!
A great profit!!

Chart 6 >>>


Back to the 5 minute chart…

Another green candle - do we exit?

No - wait - the mid BB is going down and the starc bands are going down, even walking the lower BB.

Chart 7 >>>

Hmmmmm.

2 green candles!! :frowning:
Exit now? :confused:

No - wait, for the same reasons as before.
The price action should go down further.

Chart 8 >>>

We note that the starc bands are hinting at changing direction.
So we watch carefully now.

The price had dropped all the way to 577
We entered at 672
If we had exited at 577, we would have made 2 amounts of 95 pips, that is, a total of 190 pips!!

It is sad then, that we are now back at price 600 :frowning:
But then, lets stick to the rules of the trading system. :slight_smile:
And lets not be greedy!! :slight_smile:

Chart 9 >>>

Here, the starc bands have definitely changed direction, even though the mid BB is still going down.
The price action is stalling, not going down any further.

Time to exit!!

The best exit we get is 600

We, therefore, make 2 amounts of 72 pips profit.
A final total of 144 pips.

Chart 10

Here is a final look at the main chart >>>

The price action crossing the lower BB may have been a better exit point.
The price here is 585 which is better than 600

We would then have made a total of 174 pips.

However, only by observing the starc bands on the 5 minute chart, can we know when the trade has really ended.
It is quite possible that the trade will resume, with even further falls in the price.

A later look has shown that the price action did indeed fall again - right down to 578, but by this time the mid BB was not going down so rapidly anymore, and the BB were entering a squeeze (narrowing greatly) thus indicating a restriction in price movement.

Tymen,

This last week I have been reading the first “The Joy of Candlestick Trading” and just started on part 2. I am learning so much and I just want to thank you and all the other posters in these great threads. Keep wanting to post on stuff that happened over a year ago. :smiley:

Sent Jay a email and hopefully I will be running Dealbooks 360 soon and enjoying all the lovely time frames. So far when I use the UM I have been winning or breaking even.

Brian

Doesn’t this trade contradict your most important post in the joy of candlestick trading? Doesn’t it say not to trade the reversal on a BB until you see two of them?

http://forums.babypips.com/newbie-island/18016-most-important-post-joy-candlestick-trading.html#post75774

My guess is, with the advanced method, it doesn’t matter anymore, but I’d like to ask anyway :slight_smile:


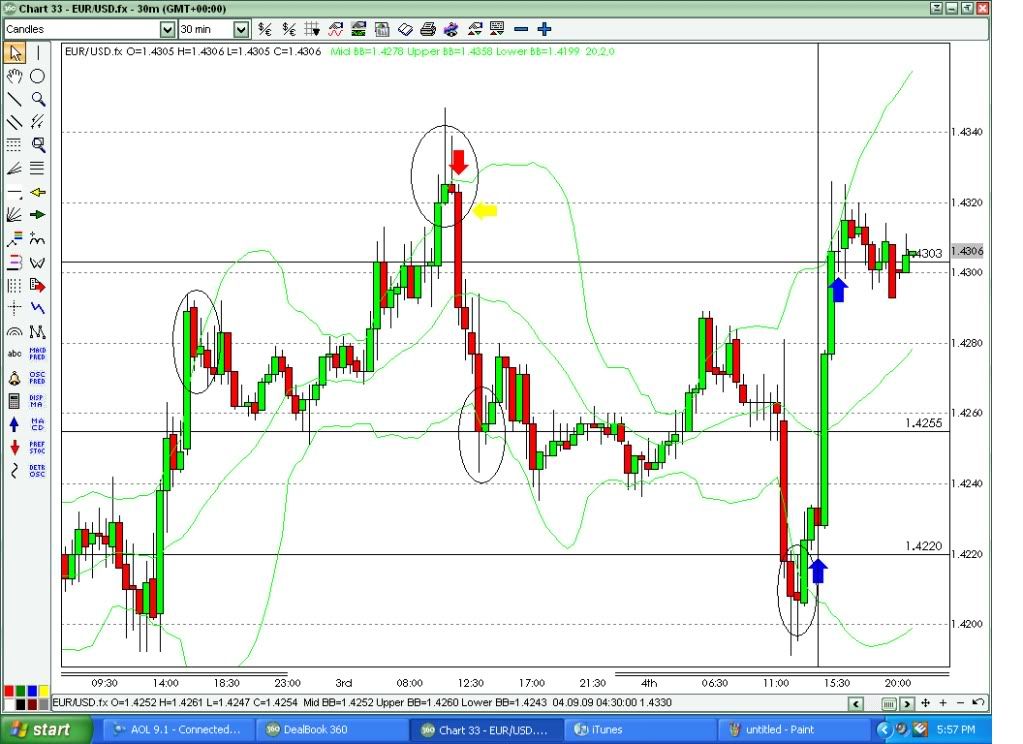
Tymen and others on this thread. I am posting my main chart 5m chart for any feedback. Did I read the candles & enter correctly or just get lucky on this trade? Thanks
I circled the pattern I used to enter. The vertical line is where the action was when I turned my computer on. The 1st blue arrow is where I entered the long trade. Stop at 1.4192. The 2nd blue arrow is exit. When I entered the trade the mid bb was not going up yet? Was it risky to enter at that point?

5 m chart showing Mid BB starting to go up and STARC bands begining to move up. I entered long when the price hit the bottom .70 starc band. I exited when the starc bands started moving sideways

You got lucky, Jack! That crazy movement was caused by the Non-Farm Payroll announcement. It’s a [I][B]huge [/B][/I]news event that’s released on the first Friday of every month.

All technical analysis goes out the window on these days. I avoid the markets like the plague on NFP Fridays. :slight_smile: