I wasnt paying attention to the news 
and I also noticed the spikes in other pairs around the same time. That’s why I was thinking I got lucky on the big spike going up
Hey guys, I’m new to the Tymen phenomen, having finally read all the required pages from the first JoCT thread (from post 1420 to end, as instructed) and the Ultimate Candlestick PDF document.
Although I intend to start out with the beginner level, I am a bit concerned that I cannot locate the Starc bands in my FXCM Micro Trading Station II platform. Does anyone else use FXCM?
I’d like to get a workaround which allows me to continue to work with just this platform, as I feel uncertain about trying to run MT4 or Dealbook separately while still trying to set trades in Trading Station in the fast-paced environment in which these trades seem to develop (witness Tymen trying to set them up while simultaneously trying to print out charts, etc.).
Hopefully someone here can give me a pointer.
These indicators were posted by someone else in this thread, can’t find it right now, so here they are. Put them in the experts/indicators folder in the MT4 installation directory, then restart the MT4 client.
MT4-for-TymenMethod.zip (11.4 KB)
2 trades today. (Hope I didnt just get lucky again today Phil!!!) Tymen and others any feedback to help improve - Thanks much.
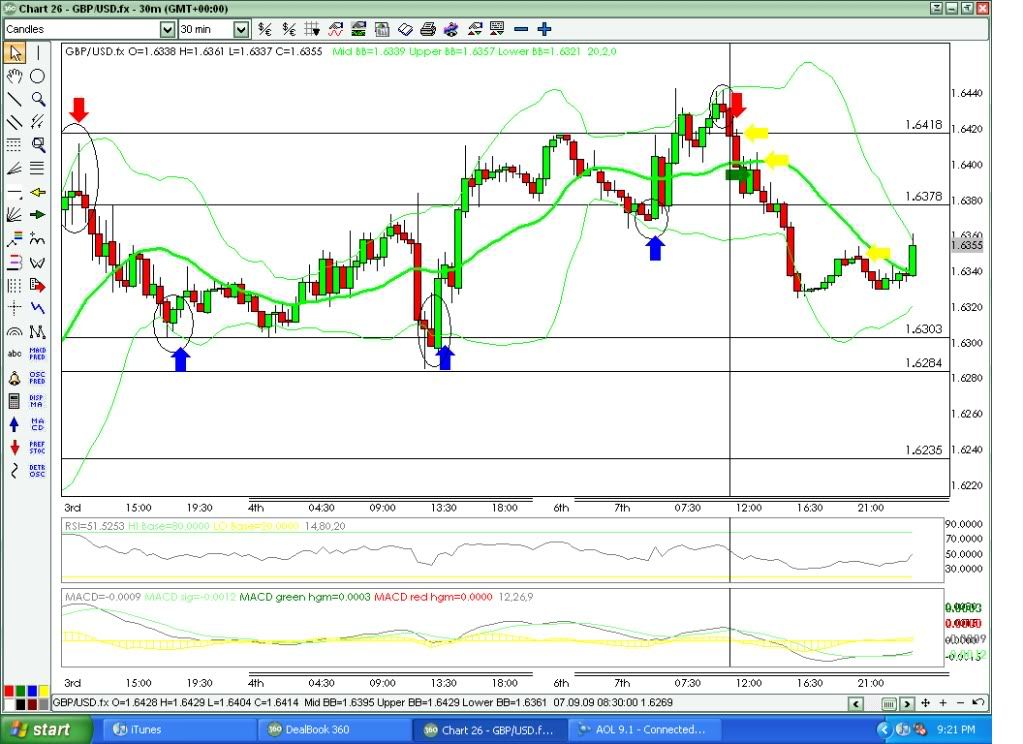
Here was my thought process in making the trades. I checked for news releases today at FX360 only items listed were for JPY. I’m trading GBP/USD so no worries there. It is a US holiday so I expect things to be slow, no sudden swings up or down. Normally I trade the begining of the Aisan session due to work:( But since the holiday I was able to trade this morning, NY time. Here is my main chart. The vertical line is what I saw and circled the pattern I was looking at. Showing me a reversal to short the pair. Yellow arrow is where I entered my 1st trade, Green arrow was my exit.
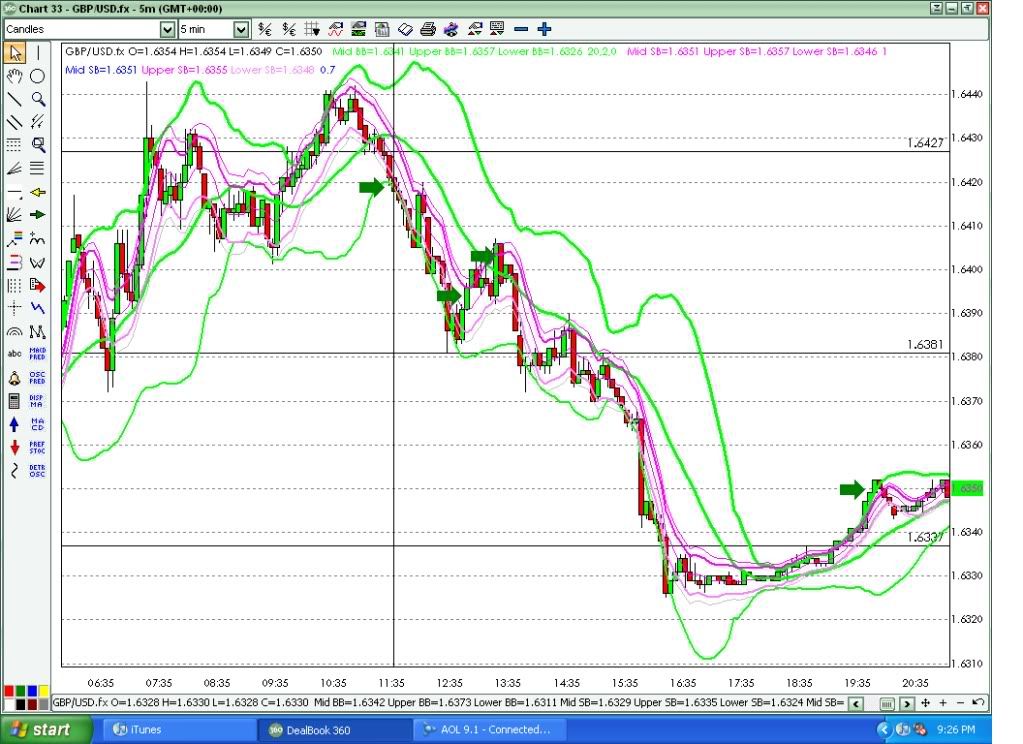
Now here is my 5 min entry chart. The vertical line is what I saw when I began. I saw STARC & Mid BB going down sharply so I entered right away 1.6418 and then placed stop at 1.6445. Not expecting much due to the holiday I exited at the 2nd green arrow 1.6394 for 24 pips. Right after I did that I thought about the rules and the Mid BB was still going down steeply so I looked for a 2nd entry and re-entered when price hit the top STARC band at 1.6403. When I hit +10 pips I placed stop at breakeven. When I hit +20 pips, I almost got out, but thought "hey I have hit my personal target for the day, let’s let this one run. I moved stop to +5 pips, set a TP of 100 pips and went out for a cook out. See last green arrow, that’s where price was when I got back. I closed out at 1.6350 for 53 pips. Total for the day 77pips.
No lucky trades today, just pure skill!
Good job! 
I wish!!!
Thanks
Jack
…(Sigh)…
I hereby give Merchantprince all credit for the MT4 zip file 
Soldier on Brian43ny!! 
You are doing very well. 

[U]You are absolutely correct in what you are saying here!! [/U] 
[B]For all people starting out on this candlestick method, I recommend that they stick closely to the rules.[/B]
However, I have had a little more practise, and have developed a certain skill at being able to pick the more likely successful trades.
I used and checked 9 time frames before deciding to trade this one.
The mid BB was flat in some of them.
Note the lower BB on this main chart - going flat, but not going up.
After a while of practise you too will be able to shade the rules a little - at some risk, of course.
Further to this, a loss on this trade would not put a dent in my funds.
I can afford to lose, some people would not take a loss as easily.
[U]Finally, and most importantly,[/U] the purpose of this example was not to show the candlestick pattern, but rather the correct use of the starc bands in relation to the Bollinger bands.
I believe that this example is excellent in that regard.
I did not want to post the main chart at first, but then thought about it.
I did post the main chart because I thought that I would be deceitful if I did not.
Even though Phil838 states that you “got lucky”, this was, nevertheless, a textbook trade.
Congratulations!! 
Everything was done perfectly!!
I suspect that, if this was not a news release, then your trade would still have been very successful, but just not as many pips made.
When I entered the trade the mid bb was not going up yet? Was it risky to enter at that point?
[U]Looking at your 5 minute chart[/U], the mid BB (thick green line) was going up quite steeply at the time of your entry (blue arrow).
No risk at all here!! 
Your entry on the lower 0.7 line was perfect!!
I notice also that there is no mention of a 2nd amount in your trade.
A 2nd amount is necessary to correct errors made when entering the first amount.
5 m chart showing Mid BB starting to go up and STARC bands begining to move up. I entered long when the price hit the bottom .70 starc band. I exited when the starc bands started moving sideways
The exit here is completely correct!!
Don’t you just like Dealbook?!
Great for posting charts - heaps of clarity!!
I like the way you thicken the 0.7 starc band lines and leave the others as thin lines.
I am sorry I cannot help you with FXCM.
But it looks like [B]DodgeV83[/B] may have come to your rescue with a file that I think was originally posted by [B]VulcanClassic[/B].
Another excellent trade - well done, especially on seeing the 2nd entry opportunity.
You are an excellent student of this candlestick system.
I saw STARC & Mid BB going down sharply so I entered right away
Yes, good procedure. 
1.6418 and then placed stop at 1.6445. Not expecting much due to the holiday I exited at the 2nd green arrow 1.6394 for 24 pips.
I notice again, no 2nd amount.
Although you are doing well here, you will encounter future trades where your 1st entry is not so good and the 2nd entry will improve on that entry.
Also, you make double the pips!!
When I hit +20 pips, I almost got out, but thought "hey I have hit my personal target for the day, let’s let this one run.
Do not exit until the starc bands re-enter the BB and move away from the BB.
There is a better way to exit giving more pips, but it is an advanced method and not good to post in this system because I am trying to keep things simple.
This advanced method of exiting is shown in Philippe Cahen’s book “Dynamic Technical Analysis”, translated from French to English.
God willing, I will be posting certain facets of his DTAFM Bollinger band trading method next year.
I moved stop to +5 pips, set a TP of 100 pips and went out for a cook out. See last green arrow, that’s where price was when I got back.
The cook out cost you the best exit but you did well anyway!! :o
Total for the day 77pips.
The best part is that you made your 77 pips in a very short time.
[B]That is the hallmark of this candlestick system - high probability trades that use sniper tactics to produce large profits in the shortest possible time.
This system’s efficiency rivals that of much longer term systems!!  :D[/B]
I hereby give VulcanClassic full credit for the MT4 files 
BTW, just had a successful trade! Thought I’d share for the group, I think the rules were followed correctly.
Main chart -

5 Minute chart -
Vertical line is when I pulled up the 5 minute chart.
First blue arrow is entry
Second blue arrow is exit.

Hmm, I missed this part! You are correct, had I stayed with the trade I would have had a much bigger pip gain…still learning

Thanks Tymen!
~Rob
Congratulations, your execution of the starc bands was very well done!! 
However, I need to take you in hand here because you have made 2 errors in this trade. (one serious)
Main chart -
[U]Here is the serious error…[/U]
The evening star pattern that you chose is a shorting pattern.
As such it needs to appear on the [U]upper Bollinger band[/U], not the mid Bollinger.
This is critical for success.
We trade such patterns into the centre (mid BB).
See "the correct use of the Bollinger bands in this hyperlink…
Had the Bollinger bands not expanded (like a trumpet) straight after your pattern, then you would have made a loss.
Therefore, you got lucky in this trade!!
5 Minute chart -
Now for the lesser error…
Although you did the starc band trade entry and exit in textbook fashion, there was no 2nd amount entry.
You may ask …why bother?? 
The importance of this 2nd amount will become apparent when you do trade entries, then discover that the price action is going the wrong way!!
I can assure you that this will happen very frequently, even when the mid BB is going your way.
[U]A single entry may cause you to panic.[/U]
The 2nd entry is a [U]powerful weapon[/U] against this, since it allows a 2nd chance at entry.
The 2nd entry will be a much better one, and your computer will average the 2 entries into one good entry.
Hope this helps.
I look forward to you posting further trades. 
I look forward to readers presenting their own trading efforts with charts.
Then we can all look at them and see how we are going. 
For myself, I will make an effort to present some more live demo trades - difficult because I am live trading and I will not post my live trades for security reasons.
Maybe 2 more from me.
But after that I will complete the work for the final PDF. 

Most of the PDF posts will be presented on this thread so that readers can comment on their clarity or level of confusion. :o
I aim to finish this thread before the 15th November like last year and apply to the Administration to have this thread locked like Part 1.
[B]The PDF will be very clearly posted.[/B]
Tymen:
Thank you for all your efforts. Appreciated. Looking forward to see some LONG trades off the lower BB too.
Muthu.
Is there a keyboard command in Dealbooks 360 for changing the time frames?
Been using the input method. Just wondering if something is faster.
I take it that you have your timeframes in different workspaces.
If that is so, then I don’t know (never thought about it)
Give technical support a ring. 

