Working my way through the time frames as we speak ST
It’ll be interesting to see how the daily AUD/CAD finishes now that it has broken below the low of the hammer ST
unless the daily set up is really good… in the crosses, I prefer to take a trade in the weekly chart. This is because they tend to trend very well…
Yes, but looking at the five minute chart the craziness has broken out so I’m happier on the sidelines, anything could happen from here. It has been a good week, don’t want to blot my copybook at this late stage, particularly with NFP tomorrow. I like to make a plan, trade it, bank the result and move on, I really don’t mind if it would have given 100 pips more after I exited, that’s true of most trades as Price can ultimately only go one of two ways, but if I have a good reason for my TP then that’s plenty for me. It could drop like a stone from here or come back up and give a massive low test, either way I’m out.
I agree with you, as ever, but I just love those tighter Stops that the Daily gives me… I never trade the crosses without looking at the Weekly first, though, to check I know where we are in the grand scheme of things. The crosses do tend to give beautiful trends, though, they’re my favoured hunting ground. Much less reactive than, say, Cable in my view.
Thank you HoG and mozdef for your reponses. Just looked at ICT’s video on S&R and he refers to “natural” S&R levels, monthly, weekly, daily highs and lows providing good reaction points. I hope I can get the hang of it quickly. One thing I have noticed that makes a HUGE impact on the success (or not) of a trade is getting the bias right, whether it is weekly, or 4H.
‘The trend is your friend until the bend at the end!’

Deliberately waited until now to start posting tonight to let the day’s trading close.
Just in light of the recent conversation about the Hammer candlestick. I was going to do it as a normal post but I thought it would be quicker to run through it as a short video. My thinking may be wrong, but it’s always worth discussing anyway.
You may have to enlarge the image and up the resolution to see it properly.
[video=youtube_share;5tWJ8ZXZZPk]http://youtu.be/5tWJ8ZXZZPk[/video]
It does make you think though that before jumping straight in to open a position based on any single candlestick forming, it might be wise to check the other time frames first.
Would it have made a difference if it had been a bullish hammer? Well, it would have made a difference to the shape of the large bearish candle on the weekly I guess, and it would have shown in the psychology of it all that the bulls were trying to fight back a bit harder.
But the honest answer right now is that I just don’t know, I reckon it is just prudent to wait for the next day’s PA to confirm the hammer somehow.
I have no idea why this picture has appeared here, it doesn’t appear on the edit page for me to delete it

Also while the equities have been mostly bullish this week along with the euro and the pound (somewhat) the aussie fell sharply due to interest rate cut. You don’t want to be standing in front of that train 
The Hanging Man
The hanging man is next one candle Reversal signal we will look at. Essentially it is the same as a Hammer. The criteria to form the actual candle is the same as the criteria to form a Hammer, long lower shadow, small body and little or no upper shadow. Also colour of the real body (bullish/bearish) is of little significance.
Difference between them though is that a Hanging Man is to be found at the top of an UP move. Theory being price moves UP, Hanging Man appears and Bob’s your auntie (no offense meant bobmaninc) price reverses.

Incidentally, you lot have no idea how hard it is to find a good hanging man for illustration purposes. A couple of centuries ago you’d find one on every street corner, but nowadays??? Oy Vey !!
Anyway, just like the Hammer though, a Hanging man is no more than an indication that the direction of price may CHANGE , and not necessarily reverse. As we can see from this picture, price moves up, the Hanging Man appears, but price moves sideways this time

Mr Candlestick tells us that it especially important to wait for bearish confirmation with the Hanging Man, the reason for this has to do with the psychology behind the formation of that candle shape.
Usually, he tells us, this kind of candle forms when the market is full of bullishness, a good up move in other words. But then a hanging man appears. Assuming we are dealing with daily candles (doesn’t have to be obviously, but let’s just assume we are) we are moving up and then on a daily Hanging man price sells off sharply but ends up closing close to the open again.
He goes on to say that this would not immediately make us think of a top reversal, but what it has done is alerted us to the fact that if the market WAS to sell off now, it would be vulnerable to a sharp decline and those who had BOUGHT on the close of the Hanging Man, could now be left…well…Hanging !!
Does a Hanging Man carry more significance if it is a bearish hanging man, maybe, possibly, but I’m only guessing there. Maybe logic would tell us that a bearish Hanging man hints at a change whereas a bullish Hanging Man could just as easily point to a continuation.
It would, I reckon, carry more weight, just like the Hammer, if it showed a rejection of a prior price level, but in either case Mr Candlesticks doesn’t say, so if you wanted the answer to that question you’d (we’d) need to look elsewhere.
The only other point Mr Candlesticks makes in the Hammer/Hanging Man section of the book that is worth reiterating is that Hammers and Hanging Men (as well as ALL candlestick formations) should always be viewed in the context of PRIOR PRICE ACTION.
That is all for now on the single candle signals. I know you get shooting stars and inverted hammers, but those will come later in the “stars” section. Next topic (says me quickly checking through the book to find it) is engulfing patterns.
SUMMARY OF HAMMERS/HANGING MEN
Hammers are a one candle reversal signal that come at the BOTTOM OF A DOWN MOVE
HANGING MEN are a one candle reversal signal that comes at the TOP OF AN UP MOVE
A reversal signal DOES NOT mean that price will reverse. A reversal signal implies that the prior move MAY CHANGE, but not necessarily in the opposite direction.
I took the next quote from the Babypips school of Pipsology, in the Lone Rangers section/ Elementary School :
“When price is falling, hammers signal that the bottom is near and price will start rising again.”
Now a couple of sentences later the school DOES go on to say that more confirmation is required before pulling the trigger on the strength of a Hammer alone, but a hammer DOES NOT signal that prices will start rising again. I’m not trying to pick a fight with the mods because the people who created this site are far more knowledgeable than me, but after reading a couple of different candlestick books, I just find that sentence misleading.
A Hammer implies, and I stress IMPLIES, a CHANGE OF DIRECTION, nothing more, nothing less.
As ST mentioned earlier today NFP is out tomorrow so I won’t be trading. Add that to the fact that Friday is one of my long days at work and I probably won’t be posting either, other than to respond to posts via my phone, so the Engulfing patterns will probably start Sunday.
Have a good weekend all if I don’t talk to you again tomorrow.
HoG
Totally forgot about that mozdef, bobmaninc did mention it earlier in the week when he was talking about shorting himself LOL!!
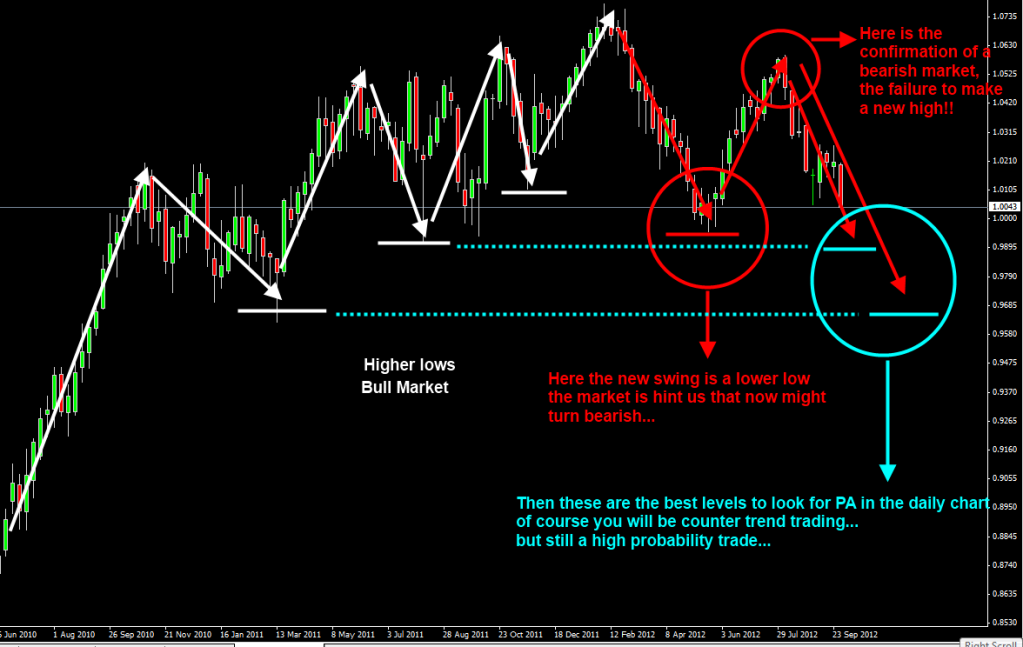
HoG, as I said the crosses are better to trade of the weekly chart, this is because they react at a slower pace than the majors.
What I do is check for S/R levels in the weekly paying attention to (what I call) the market flow… then I now if we are in a bull/bear market…
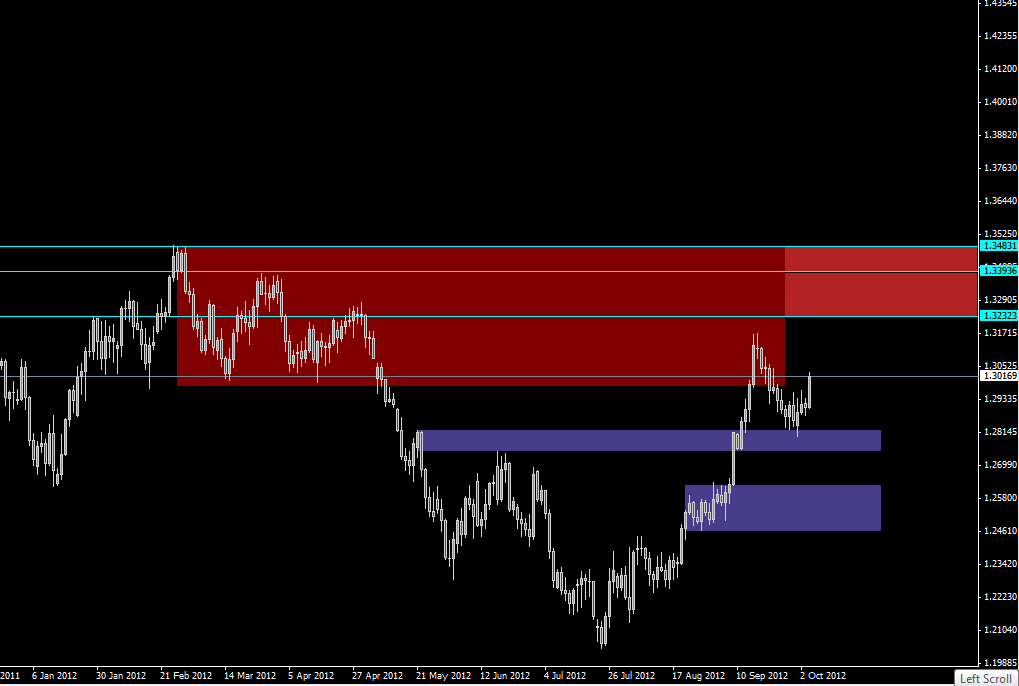
For example in the AUD/CAD we are in a bearish market…and I have already marked my areas to look for PA in the daily and then go long…
http://i1086.photobucket.com/albums/j449/yunny11/eurusd136.png
Is that your sole system support and resistance and price action? Do u ever look for pullbacks to get short in a bearish market?
EDIT: I’m just curious yunny was wondering of you ever incorporate anything else or if that’s enough?
Yes I look for pullbacks in a lower time frame but only at the start of a trending market, using the same tools…
For example, in the AUD/CAD I never chase a short trade at these levels, unless a strong confirmation of support turn into resistance…
This is enough to be profitable once you have mastered it… you need nothing more…
However I use other tools, mostly as confirmation. The best in my opinion are Fibos (drawn in the daily and weekly), weekly and monthly lows, and simple moving averages (daily 21,50,100,200)
I use 2 charts… one just candlesticks and S/R drawn by me and the other with all my indis…
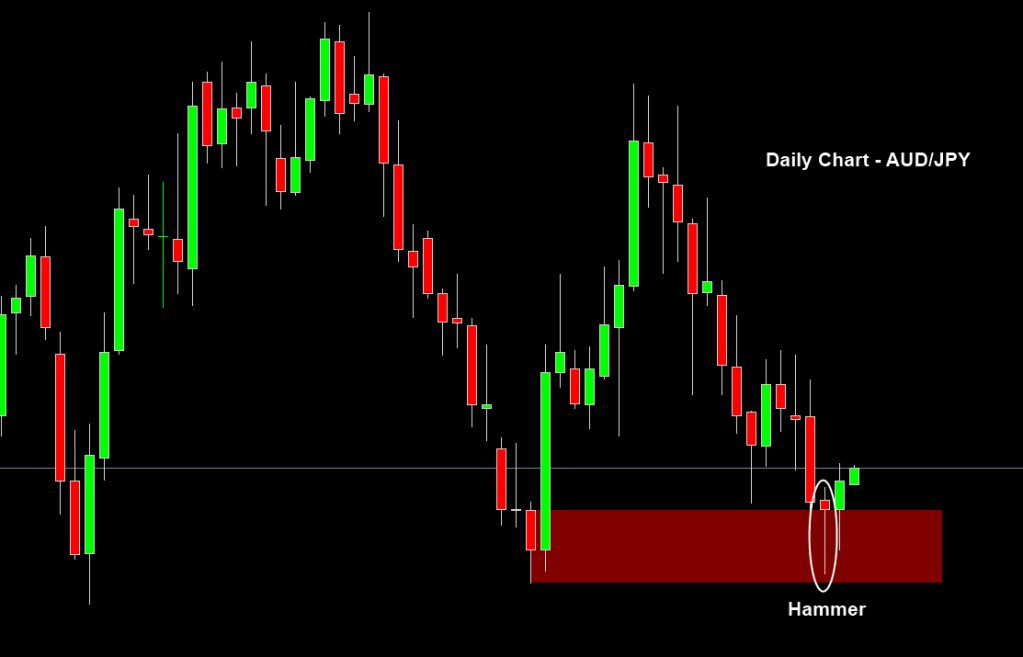
Last Night I traded the A/Y hammer… but since we are in a AUD bearish environment, I trailed it too tight and got stop out for 30 pips profit… looks now price is heading up without me 
http://i1086.photobucket.com/albums/j449/yunny11/eurusd137.png
http://i1086.photobucket.com/albums/j449/yunny11/eurusd138.png
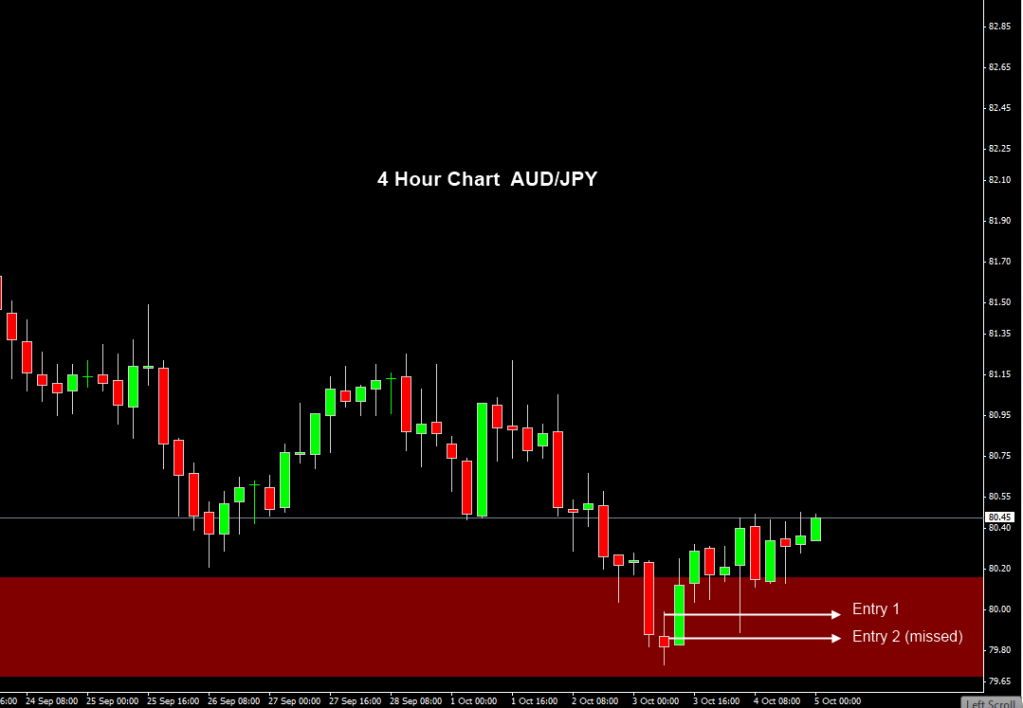
Yunny, I would like to ask you about the two entry levels from the above 4H chart. Please explain how did enter these trades. Do you place entry order after closing the doji candle? I really don’t understand why about the second entry.
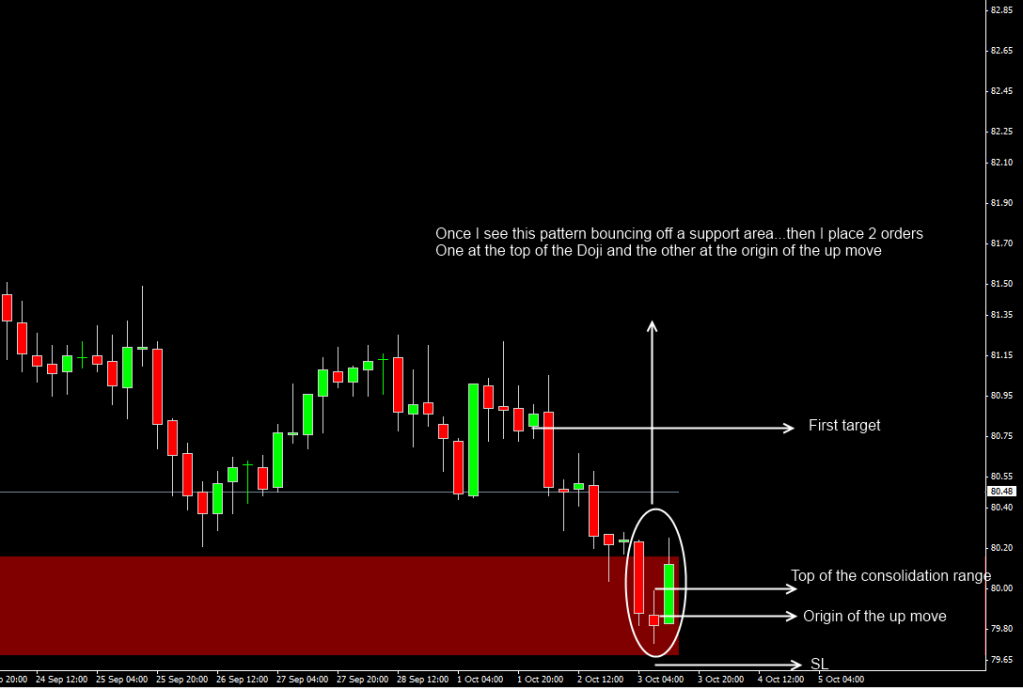
I often place an Entry half way up the bar for my EOD trading, which would quite often put it in a similar zone to your ‘origin of the move’ Entry, it does give a nice R:R when it works out!
Yunny and ST … from your posts and the way you describe how you trade I can see that you are experienced traders who have developed the proper mindset and have a great deal of patience in trading. I feel that my biggest enemy is just that, I do not have the patience required to achieve consistency. I know that we are still discussing candlestick patterns so sorry HoG and everyone if I sidetracked a little the thread … but what is your advice in relation to this area of trading for a struggling trader like myself? Did you always have the proper mindset and patience?..and if not how did you manage to overcome it?