The Trader's Arms - Now Open for Business

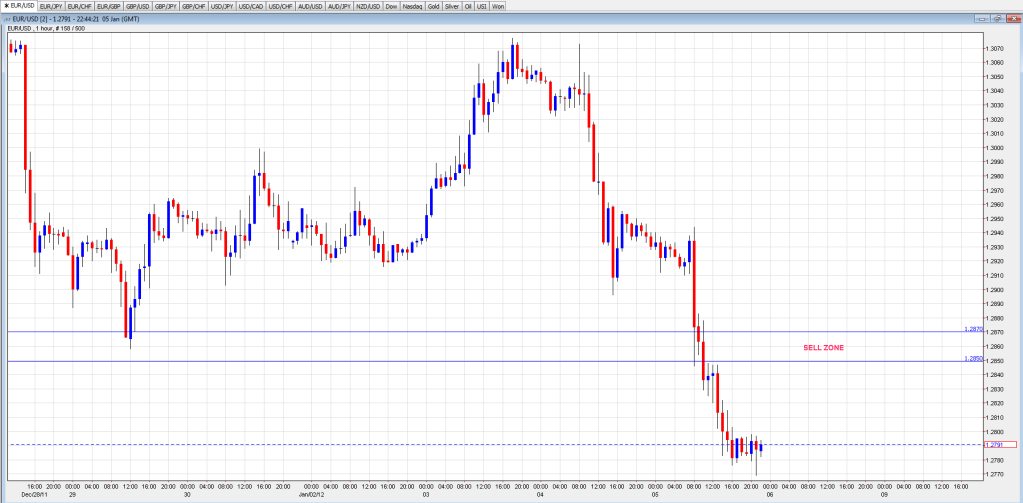
Back to the 1 hour chart we go.

1 Hour:

Well, the dark cloud cover, ( in yellow ) from yesterday did hold bearish. However, as you can see, you may well NOT have taken the trade until almost the end of the Asian session with the next lage (ish) red candle drop. (5 candles to the right of the yellow box). Even then, however, if you had entered there, placing your stop at the weekly R1, you may have had a little fright with the retest 6 candles to the right of that !

This 2nd failure may well have been the better entry signal had you waited that long.

Moving up to the 4 Hour again:

4 Hour:

I believe the more cavalier traders amongst us may have taken the close of the shooting star from yesterday ( in yellow ) as their entry point.

The more conservative trader, may have waited until the retest (in orange) and subsequent failure, to provide better confirmation, and therefore a better short signal.

(Incidentally, the area shaded in green, a rejection of recent low areas, would now be entering our minds in today’s analysis as possibly pointing to an up day for today. But let’s not get ahead of ourselves just yet )

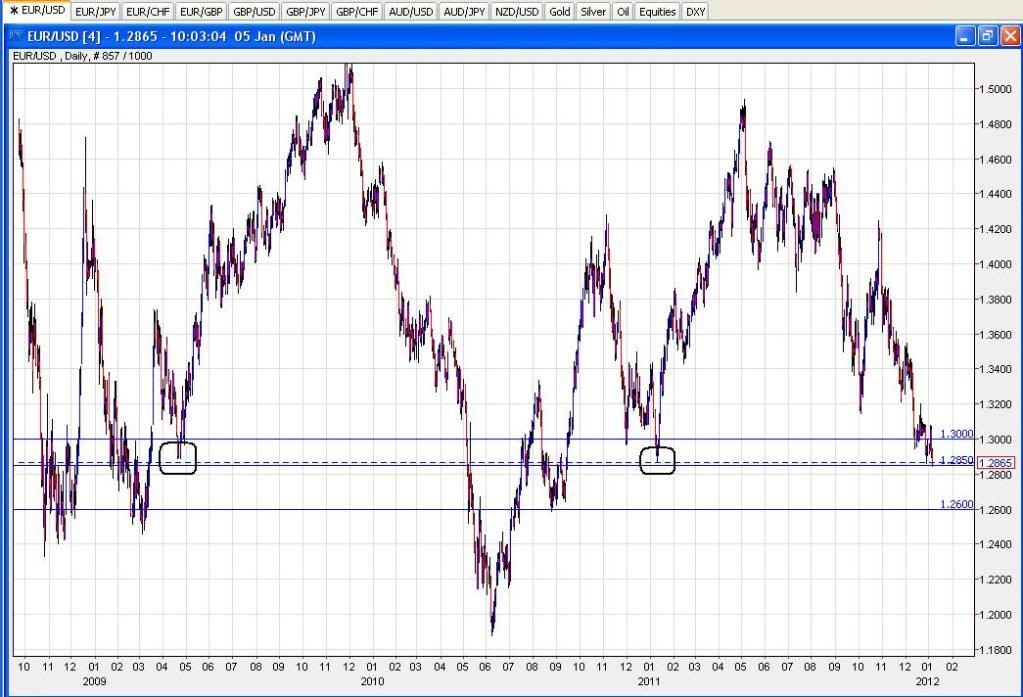
Moving up again to the Daily Chart:

Daily:

This shows the down move of earlier today. Interestingly enough though, ( and this may bring the green shaded area from the 4 Hour back into our minds ) it does show a recent reluctance to close below the 1-2930 area. ( marked in blue )

The last 3 weekly support lines, which all more or less form the same line, are all showing the strong 1-2850 support area. So that, for now anyway, really is the bottom line.

So what next ??

Well, as I said yesterday, I’m not trading this week. I genuinely have too many distractions going on this week to give this the attention it needs, so I’m Mr Sidelines for now. But, all being well, I’ll do this again tomorrow, just going over what happened.

The purpose of doing this, ( in case anyone is asking themselves what’s the point of going over what has already happened) is obviously for newbies. This is just an attempt to give ourselves a basic understanding of analysing past price action, using basic Support and resistance levels, and candlestick patterns.

This would be the same process we would use if we decided to backtest this basic method of trading, by going back, say, 2 years on our charts. We’d add our S & R levels, and using these, and our knowledge of candlestick formations, try to predict the price movement by moving the chart forward one candle at a time, on a few different timeframes.

By doing this, we’d be developing our first, simple, but effective enough, trading method.

Please forgive me if I’m sounding like a ‘know-it-all’ by writing this. I assure you all I don’t, and it is certainly NOT my intention to sound like one. As I mentioned at the start of this thread, I am going back to learning from the start myself. And this is what I am doing myself just now this week.

This thread was always intentioned to be my “think out loud” platform, telling what I’m trying to learn, how I’m trying to learn it, the process I’m using. But the obvious advantage I have here is that I know there are some very knowledgeable minds popping in and out of these doors who are normally more than willing to advise when we’ve picked something up wrong, or misunderstood something.

(or kick our arse when we just get it plain bloody wrong !! LOL )

Anyway, talk to you all soon.

HoG

Looks like we’re at the first of two major areas of support.

If 1.2850 doesn’t hold then we’re down to 1.26. I don’t see any particular reason for 1.2850 to hold at the moment. If we do get a bounce up I’ll take that as another shorting opportunity. Don’t see any reason to go against the dominant bias for now.

On a separate note decided to bump up my account size a bit. Spent the past year trading small amounts live seeing how combining a full time, busy job with trading went. Luckily I work in the financial industry and can browse charts, etc. at work so seems to be working out ok so far. Bumped up the account to €1,000 on Jan 2nd to give me a new year start and targets for the year. Aiming for 3% per week. Had a good start to the year with short EUR and long Gold and am up to 1075.91. Flat now again but will be looking for another EUR short at some point with a target of ~1.26.

I agree with your view, pipbandit. Next support for me is monthly S1 @ 1.2688

I closed all my shorts when we got at 1.2950… from there I have been taking longs intraday, counter trend trading for small profits. :stuck_out_tongue:

Only if it decides to stop Raining the apex came off the roof of my house yester day i the wind guess i better take this
trading lark seriously

well thats Decemeber 10 support broke next stop 1.25796 question how are going to get there aggresive or gradual
the big question is what is the smart money doing here accumilating or distributing, then i need to work how that is going to
give me entry and exits.

could this be the long move down on the weekly in play which would mean a move down to 1.20335 is it on the cards
or is it the long move up on the weekly which mean looking for bounce at 1.25700s

for now all i can say is 1.25700s seem a pretty big area to watch going forward

Patience/Discipline

I genuinely wish you the best of luck witht the increased account pipbandit. Please keep us up to date how you are getting on, and if you could also manage to post some more charts if you get time along the way, that would be a great help to. I see this thread, as I mentioned before, as a “think out loud” platform, hopefully with the result of helping ourselves and others along the way.

Obviously I’m not asking you to divulge any info you are not comfortable giving out, but it’s good sometimes just to hear what is rattling around in another traders head.

Keep up the good work and best of luck again.

HoG

Funny you should say that, although I now drive a Hackney cab in Glasgow, I am a roofer to trade. I have spent the last 2 days repairing the roofs of my wife’s friends who live on our estate.

Physical exhaustion has now swept the body of the 45 year old cabbie who hasn’t done a days physical graft in years LOL !

HoG

Where are all the crystal balls when we need them most Scratch?? LOL :slight_smile:

As I mentioned in a reply to Scratchfx just above, I have been busy repairing roofs all day today and when I DID get home, I crawled upstairs and into a hot bath, on the verge of weeping uncontrolably, mainly because I have lost the feeling in most of my body. And the bits I CAN feel hurt like hell LOL !

So the result of this is that I haven’t even had a glimpse of a chart intil I sat in front of the pc just now, at 20:27 UK. What I saw in the charts has taken me a little by surprise, and to be brutally honest, I just don’t have the energy to plough through a basic post mortem of it all just now. (I would much prefer just to lay down in a dark room and whimper like a baby right now. Which is exactly what I am going to do, including the whimpering part !!)

I’ll try to throw on some charts tomorrow night, maybe just wait til the weekend and do a week’s post mortem.

My apologies again.

I would just add before I go that I lost 18 pips last night on cable. Yes I know I said I wasn’t going to trade, but I’m actually quite pleased with the trade, even though it lost.

Sold at 1-5610, stop was 1-5628, target was 1-5580. Price got down to 1-5587 before it popped back up to 1-5630, taking me out by 2 pips, THEN collapsed.

Post mortem of that would possibly show an entry just a fraction too early. I lost 18 pips but overall happy enough with the trade.

Only possible rule breaker was that I put the trade on then went to bed. Had I stuck to my babysitting preference…who knows, not going to go there. Trade lost, end of :slight_smile:

Anyway, apologies again gang, talk soon.

HoG

Cheers HoG - appreciated. No problem sticking up charts. Not like I have some fancy dan proprietary system. Just the obvious reaction points on the 4H and Daily charts and toss in the session / daily / weekly / monthly high & lows with some kind of a price action hook into the trade and I’m good to go. All borrowed liberally from the Technical Templates thread.

Typically what I would be looking at now would be this very basic setup at the moment in E/U with a sell if price has a look up at the 1.2850-70 region. 1.2850 was a major area of support before so chances are it’ll act as decent resistance now. Would like to see this play out around the London open but with NFPs coming up might not be a runner tomorrow. Didn’t take anything today and probably won’t take anything tomorrow either.

Hehe… better late than never… mines a Fullers ESB! :smiley: You have got that under the counter right? You know the ‘nambe pamby, London’ers preferred real ale’. First to stand me a pint gets the inside track on EU? :smiley: Stay off the roof Hog… a guy with a Rupert Bear complex should know his boundaries? Pink trousers and tiles is ok but is it considered? LOL

So… EU? Hmm… there’s a bounce coming right about now (1.27).

I think it’s a little bit too soon to look for a bounce on EU. It’s the weekend after all. Have an ESB for me… I’ve had a Guiness or two :smiley:

Personally I think it’s the exact opposite RC. Once you’ve done the Pink Rupert Bear strides in Glasgow, there surely are NO boundaries left to conquer in life, heaven or earth LOL !! :18: Sort of opens up a a whole new dimension of freedom.

As for the roof, I need to go up on it, I’d hate to see the Mrs up there all alone (He-He)

So, before the new week gets under way, have this one on the house :

Good luck to all in their trading this week.

Anyway, here’s another basic question thrown intot he mix.

If you were noting a support point, would you use the lowest point of the wick that price reached on the lowest candle as the support point, or the lowest point of the Real Body of the candle as support?

Then the question would just be reversed ( highs instead of lows ) for noting a resistance point.

Just thought I’d add this weekly chart going back 5 years:

Does look as though 1-2575 area would be a big barrier to go through, AND a difficult one.

Not saying it can’t, just saying it’s a big barrier

Hmm, I think the opposite. Oh, have I ever mentioned I am a contrarian, lol? :wink:

No seriously, it’s imho stronger than that lower low at 118xxxx. Why? Because it’s not that obvious! Plus we have the same strong rally as we had from 125ish around. Sure it can shoot through, but you must also consider that we had already broken some support levels without a big rebound. So after all bears might ge a little exhausted? Look at the other red candles in a strong downmove. How many and for how long?

Regarding your other question: Seiden says use the wick and some pips lower/higher for a stop. :slight_smile:

Just on that point alone, I was wondering how highly you rate Seiden. Have to be honest and say I haven’t watched his videos or don’t really know toomuch about him. However I have heard him mentioned several times throughout the forum.

On a completely seperate note, I just found your Q&A. Quite enjoyed reading that. I now have an image of you instead of the one we all make up as what we think someone looks like:)

On another point about the ‘red candles and how many’, I watched a Stee Nison video the other week, part of which dealt with what he called “Record Sessions”. Basically it was about the number of successive red candles, ( or white) where a lower low is made, with only one white candle ( or higher low ) in between any point to break the succession. If you see what I mean.

He reckons you will rarely get more than 12 or 13 of successive lower low candles (or higher high candles) before a rebound.

If I can find the video again I’ll try to work out some way of adding a link to it as I feel I may not have explained it too well.

HoG

Hey HoG,

glad you enyoyed the qa. Well, I’ve seen ALL of the Seiden videos. So I could probably sing a song about it, lol. :smiley: What I find really good about his lessons is that he explains exactly [U]why[/U] he suggests this or that and it really makes a lot of sense! I mean, I have a lot of background and what he tells is for sure right. Indeed, another question is all the other stuff like money management and so on and so those lessons are just a start and I wouldn’t trade on that alone. As I mentioned, I wouldn’t trade seriously outside of a system.

If you look at the pa of your last chart then you can see that the last move has reached an end if you compare that to other strong moves. Again, I’m not saying it can’t drop further, but probability speaks imho for a rebound soon. At least maybe 100 or 200 pips and maybe more. This pair is simply ripe for a powerful rebound or at least pullback imho.

Was it on the FXstreet site you watched the Seiden videos Buckscoder? Or is there another source?

Anyway, off to the land of nod now people. I think I am back in the trading saddle as of tomorrow so talk then.

Also back up on the roofs tomorrow, so at least if the fiber doesn’t reach a new high, I might !!