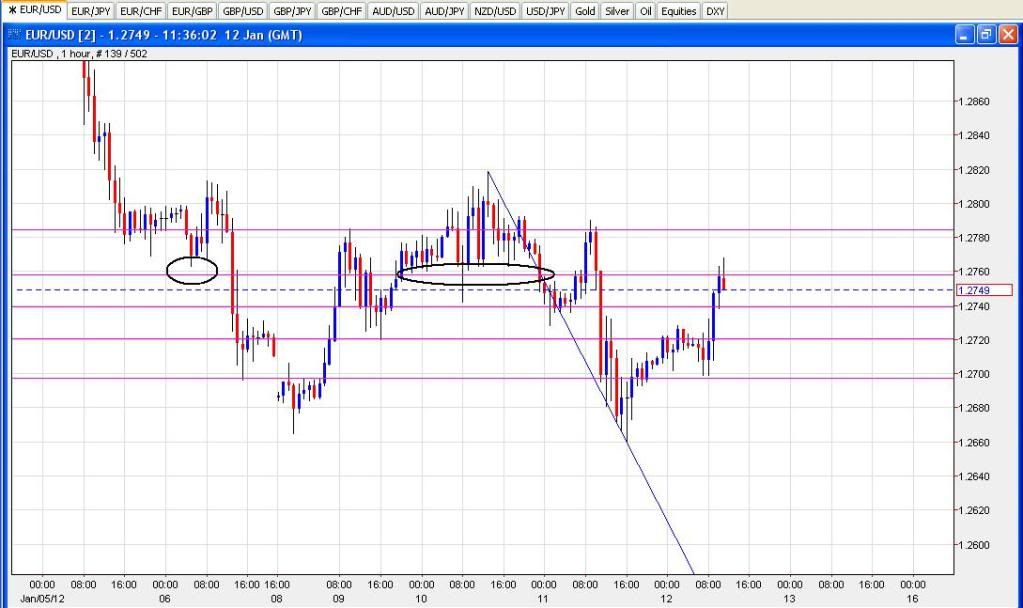
Having a go at a short here at 1.2760. 61% retrace of yesterday’s drop. Also a previous support zone. Have the ECB rate announcement and then the press conference coming up in a bit so I’ve moved my stop to BE already now that I’m +13. Don’t want to get caught out by a spike. If we get a pop up later I’ll be looking for a short again.
I deny everything, it’s just a code I’ve always lived by LOL !!
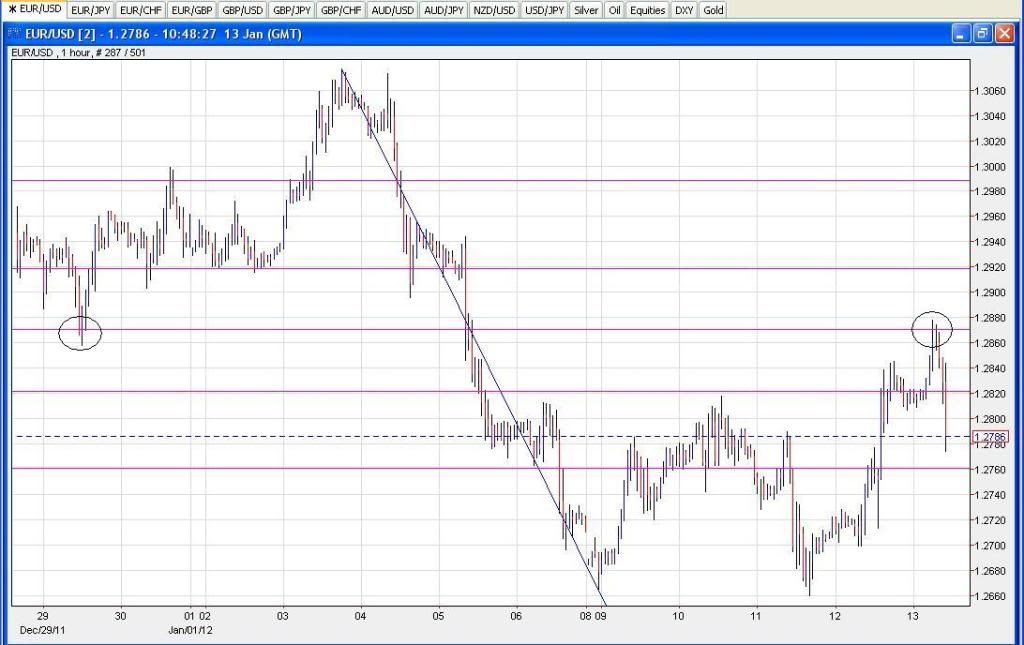
Anyway, just left a short order at 1-2840. Whether it gets there or not, dunno. But with 1-2850 being previous resistance area, it’s not the worse shot if you ask me.
If it doesn’t make it, nothing lost
EDIT: Just moved the entry up to 1-2844. I know it’s only 4 pips, but hey, why not??
EDIT 2 : Can you believe price just hit 1-2840 and moved down? I can feel an AAAARRRRRGGGHHH coming on people !!!
On a more serious note though. How do you differenciate a STRONG RESISTANCE/SUPPORT, from a SOFT RESISTANCE/SUPPORT? Does it come down to the number of times the level is tested? And if it does, tested over what time period?
I’d look at the number of times that price has reacted to the level and also the size of the reaction. I look back a couple of years on the daily for this big reaction levels.
Usually the level is stronger if is the same in the 1H, and 8H or Daily chart.
Other sign of strength of the level is how far the price move away from the congestion area, for example if you are looking at the 1H chart, body of the candle has to be at least 30 pips, the better if the following candles have long bodies too.
Which is very similar to myself, I feel as though I’ve had my shorts squeezed LOL !!
I DID go short again though as price did eventually pop back up. I am short from 1-2835.
And was looking at a long GU as at the time price (this morning) was down to a strong support area, (1-5280ish). But like I said in an earlier post, trying to get the timing right after my spell away has left me a bit hesitant and lacking in confidence. Either that or it’s still the hangover from the larger loss which I haven’t traded a lot since.
I guess confidence plays as big a part of the sum as your analysis does eh?
We released a new iPad specific app a few weeks ago if you want to give this one a try FXCM Trading Station Mobile for iPad for iPad on the iTunes App Store . This will be better than using the iPhone specific app on the iPad. The charting is basic at this point, but we’ll be adding more features in a future update. Also, a new iPhone app version was released in December adding candlestick charts, more time frames, and indicators to the iPhone app. So check to make sure you have the most up to date version from iTunes.
I have come to the conclusion that no matter your bias, if you know how to pick out your entries and manage your risk there will be a good chance to be profitable.
From 1.2980 I have been placing more longs than shorts and even trading against the trend i managed to grab a lot of pips…
I got the new iPhone version. Charts certainly an improvement but not good enough yet to convince me to use them to make a trade on. Some of the guys recently on this thread pointed me in the direction of the trade interceptor which has a much better charting set up.
Don’t get me wrong, I use FXCM Trading Station II on my pc, have also had a look at a few other platforms, and am still convinced FXCM is by far the better pc platform. (imho) The apps side of things though still doesn’t do it for me.
One other thing I would like to mention, ( I know this is unfair unloading all this on to you, but I’ll throw it at you anyway, sorry) I have 3 pc’s in my house. That’s actually a lie, 2 pc’s and a small netbook. But depending on who is using what device at any given time, I could quite possibly use all 3 devices, at different times of the day, to check the charts.
Now the thing that annoys me is this. I go on to the first pc and add my S&R lines, fibs, trend lines or whatever and I may then shut that device down. Sometime later I may log on to one of the other devices, but on this 2nd device, all of the lines I have drawn are gone, they are only specific to the device I have drawn them on to, instead of being on the charts regardless of the device.
So now I have to draw them all again. And if I happen to be on the 3rd device at any point, they’re all gone again. Now you could obviously argue that most people may only have 1 device. But what if you where out and about, or on holiday, and tried to check the charts? You’re lines don’t go with you. I hope you get what I mean. It’s just annoying sometimes.
Anyway, apoplogies for the rant. Thanks for the suggestions
I could be thinking of my other trading account but I am pretty sure you can save format/profile or what ever they want to call it and when you log in you can just load it back up. Like I said though I now have a couple trading accounts and it is getting confusing to keep up with it. BUt I will say as I sit here typing I have a desktop hooked to a 38" led tv I use for a monitor, another desktop hooked to 2 smaller flat screen monitors, and I am typing on my laptop thats now mobile again. I can pull any chart up on any of these at anytime without a problem. Dont matter what broker I use. Honestly though I only use tradestation charting for price overlays where I have the cable and the fiber along with USDX all line charts on 1 chart so once I set that up one each computer it would stay there. Not like S/R lines.
I find that anything I add to my charts is device specific with FXCM TS II charts. If I go to another computer I need to add all of settings and lines again.
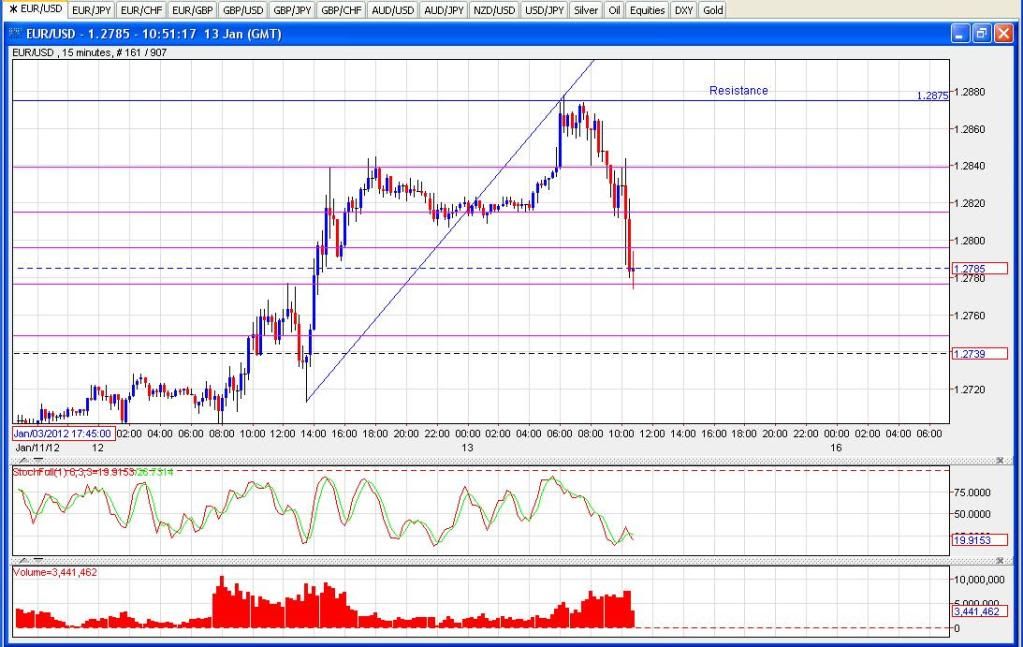
An example of a intra-day trade type that I tend to look for. Was looking for a short and entered at 1.2871 where the 50% fib lined up with previous support, the rise had started to look pretty laboured on the 15m and the stochastic on the 15m had started to turn down.
Doesn’t always play out quite so nicely as this. Normally I’d be looking to wait for the 61% retrace on the 1H which would have had price up around 1.2920 which also corresponded with a nice previous support area but the 15m seemed to be giving me the nod at the 50% Fib for today so went ahead and took it.
Short from break of New York high (1-2846) just hit my target at 50 fib level 1-2775.
Not entirely sure I’ll be doing much else in the way of trading today. Will just have to watch as I didn’t have anything else in mind to be honest with you all.
In the meantime, if nothing else does happen before tonights close, account has grown well this week, roughly 4.5% from around $207 to current $216.16
Happy with that overall, especially as I found it difficult to get into the swing of things this week. Will now use around 4.5% as my target for the next couple weeks, trying to build in confidence as I go.