I wanted to introduce a new trading setup that I have been backtesting and am very excited about and would appreciate any feedback from.
PLEASE NOTE:
I AM NOT TRADING THIS STRATEGY LIVE YET AND AM NOT SUGGESTING ANYONE TRADE THIS LIVE. IF YOU TRADE THIS STRATEGY LIVE YOU WILL DO SO AT YOUR OWN RISK. I will be letting you know once I go live
With that said, I have tried many strategies over the years and I recently came across a pretty consistent setup. This new trading setup is something I plan to be adding to my lineup after some further testing. When i started out learning trading, I studied Supply and Demand zones. This is a relatively popular strategy that you will see scattered amongst the forums and I won’t go into too much detail here as I think chart pictures will help explain. As my learning evolved I then came across Support and Resistance lines and the power behind role reversals, such as support turns into resistance or resistance turns into support. The WV trading strategy will be easier to understand if you are already familiar with Supply and Demand Strategies and Support and Resistance role reversal strategies. I will be happy to answer any questions though. The main idea with the WV strategy is to find a solid supply or demand zone and then scroll further back in the chart and see if this zone is also backed up by a Support or Resistance line or evidence or previous support or resistance. This means that when you enter a trade on a WV setup, you will be getting both the Supply and Demand & the Support and Resistance role reversal traders on your side. I feel this really helps to stacking the odds in your favor.
Here are the specifications to apply the WV setup:
I use either the Daily, 4 hour, or 1 hour chart.
Only the Major pairs: AUD,CAD,CHF,EUR,JPY,NZD,USD (Sometimes SGD)
Standard Stop Loss is about 30-50 pips (depends on the situation and time frame)
Risk Reward: Looking to get about 1:1 for each trade, but it it more based off the most recent swing high or swing low. You want to take some profit before it gets to the swing high or swing low abd move your stop loss to break even once you take first profit. I am considering trying a trailing stop to try and squeeze more profit out of these, but for now just sticking to about 1:1.
I will be posting current setups that I see as they come up. I will try and post the chart before entry so that we can all see the before and after effect. I will also be keeping tabs on P/L. Anyone PLEASE feel free to comment or post charts of their own and I can comment. Everyone is welcome here!
Best regards,
Bronz
Edit: I see now that the charts are a bit hard to see so I will be sure to post more zoomed in charts in the future.
Hope works for you but in my opinion is not the best set up. Of course I have been wrong a lot of times before. It is late here, so tomorrow I’ll explain my reasons. Keep the good work
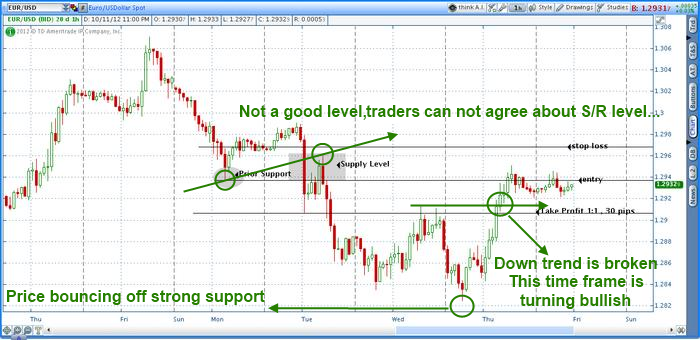
Guilty as charged haha. Obviously every trade with this method is not going to be a fat winner ( hence EURUSD trade posted) but main intent was to show a recent example.
It appears your intuition was correct lol. Would appreciate that explanation once you get a moment :). Hindsight, not the best looking supply zone as price seemed to jump up before it retreated down
Also, Note to all,
I want this thread and strategy to be completely transparent and I will be posting results so people can see how effective ( or ineffective haha) this method could be over a span of time. I wish more threads would actively track results for everyone to see. Sometimes there is a lot of variability in results even in a strategy that works and I think it’s important that people see that and realize that losses are inevitable and strings of losses cannot be avoided. I intend to show that over the long run.
I will do a new post with current results. EURUSD was a loss of 30 pips.
I try to not use any indicators at all on my charts. I believe price is the best indicator itself. I am in the office right now but I will post some chart examples when I am back at home to help explain. Thanks for the post!
Thanks for your words but it wasn’t intuition… not that I was 100% sure about the outcome, but my analysis told me it was not a good level to go short…
To grasp the concept of Supply and Demand, you first need to understand that when you look at a chart all you are seeing is order flow. Buy orders and Sell orders. If price is going up on a chart, it means that there is more buyers than sellers in a market (Meaning that there is more demand in the market), and if price is going down it means that there is more sellers than there are buyers in the market (meaning that there is more supply in the market). The supply and demand strategy is based on trying to find areas on the chart where there is a big imbalance between supply and demand. These areas will be signified by a small grouping in price and then a large move in one direction showing that there much more buyers or sellers at that original area. Here is a chart example:
The idea is that you want to short the first retracement back into a supply zone and you want to go long on the first retracement into a demand zone. Theoretically, there should still be unfilled sell orders left on the table at a supply zone and unfilled buy order left on the table for a demand zone. On the first revisit, the unfilled orders will be flled and it should force price back in the opposite direction. Each time price revisits this supply or demand area more of those orders will be filled until all opposing orders run out, meaning that the more revisits back to that price area the more likely it is that price will break through.
You can also think of it this way, the only traders that can move the markets are the big institutions such as the banks or big mutual funds or such. When you see a supply or demand zone form you know that a big institutional trader(s) have a big position there, so theoretically, if price were to go against them then the big institution would flood the market again with orders defending that position forcing price in the original direction of the supply or demand zone. Once we believe we have these areas established on a chart, all we need to do is place our orders accordingly to take advantage of this institutional order flow.
Here is an example of a demand zone:
i hope this helps to grasp the concept a bit. Please let me know if you have any questions! =)
Bronz
Edit: looks like the first attachment didnt work. Let’s try here (example of supply zone):
Thank you for this information! i definitely see some improvements now that can be made. I can see now how if there is indecision between the support or resistance line then that makes for a less probable trade. This is definitely something I will be looking at more closely.
Have a quick question though about the price consolidation you pointed out. I haven’t seen this mentioned before and I was just wondering what the thought process is behind that. Or is this just something to look for to increase the probability of a good trade? Is it a more probable trade because price was consolidating as it was moving up and then as it was moving down it was a smoother down move? I’m assuming this gives clues to the path of least resistance (to take a term from reminiscence of a stock operator…great book)
That was a great answer, very thorough.
I watched a Sam Seiden video a few hours ago, and it looks like you have covered it pretty well, thanks.
You should have posted this earlier, it would have saved me the time lol.
One more question, on a more technical level:
What rules do you follow when drawing those zones? I see some lines going through the close of the candles , then others touch the wicks. I know its not meant to be exact, but do you have any specific rules to follow?
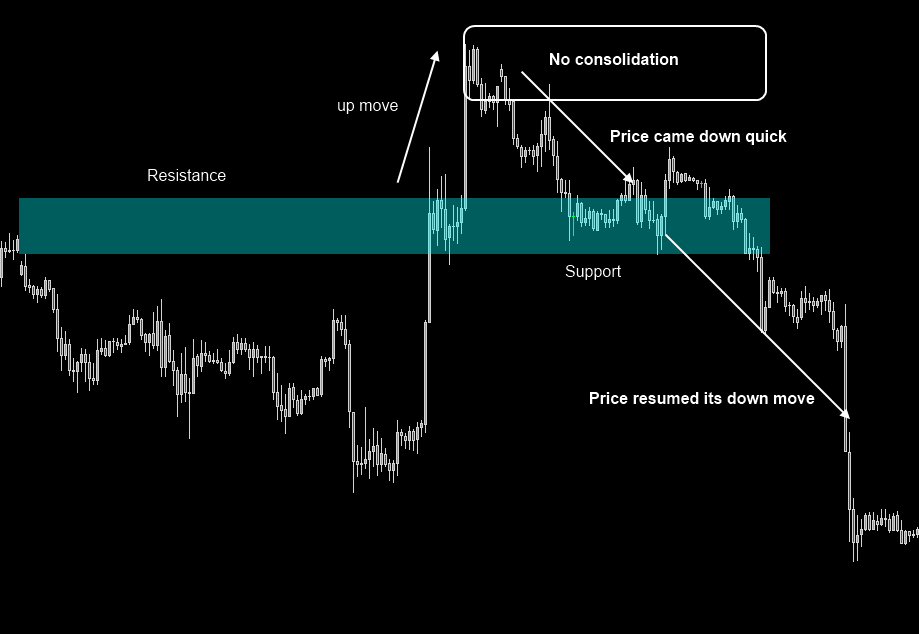
The hypothesis behind the price consolidation is that traders after the breakout must agree with the move… so price stays above/below the S/D zone for a while… if there are orders left to be filled then price will come back but in an orderly manner and at that level new orders from new traders will appear… plus any options will be place behind those levels. so institutions might defend them better… This increases the probability of a winning trade
The best entry would have been at the first revisit of supply zone/resistance line which was the first candle that pierced the lower line. I placed the lower line at 1.2937. I didn’t physically take this trade (because i was late to the game) but I will count it in my results since I posted it as a possible trade. The strongest trades are those taken at the first retracement to the supply or demand zone after there has already been a large move that occurred (which in essence this large move in price defines that zone as a supply or demand zone). As you can see from yunny1’s post this wasn’t the best setup for the reasons listed in his post (#12). Hope this helps! Please let me know if you have any questions.
No problem! Happy to help! I must say that i used to watch a lot of those Sam Seiden videos and he really does a great job in explaining and showing how to trade supply and demand zones. I tried trading supply and demand in the way he teaches in the videos, but was never consistently profitable and I could never figure out why (probably because i never signed up for OTA haha). I am hoping that the strategy that I am showing in this thread is the missing link that they don’t talk about in the videos.
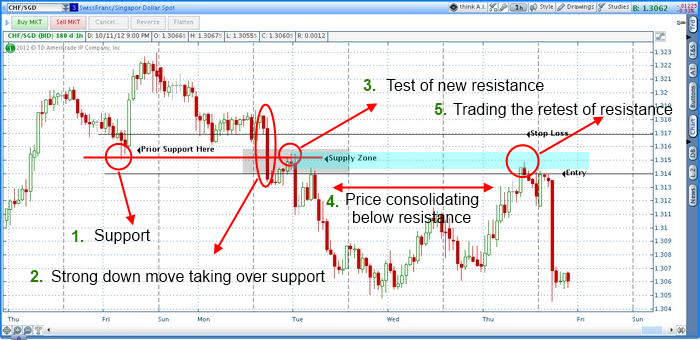
Anyways, back to your question, I am assuming your are referencing just the supply and demand levels but I will try and go into detail on the differences between support and resistance trading and supply and demand trading. Supply and demand trading does not involve cutting through candles. You will identify the zone and and then take the first retracement back into that zone. Now Support and Resistance trading (as I have defined it for this strategy), involves role reversals. Meaning that what was once support will become resistance and what was once resistance will become support once the original level is broken. Here is a chart example of this role reversal taking place:
As you can see, you do cut through candles when taking Support and Resistance role reversal trades. The strategy that I am trying to teach and perfect involves cutting through candles in the correct sense for support and resistance and also involving of no cutting of candles in the correct sense for supply and demand trading.
Hope this helps! Please let me know if you have any other questions.