In Trade Revenue Pro we use simple price action and chart patterns to identify market direction then execute our trades.
Our Trading system mainly focuses on catching trend reversal as early as possible. That way we can new trend early and also helps to maintain a good risk to reward ratio.
In this section, we hope to share our trade idea and trade we closed. But keep in mind all the chart we shared here are not advised place any trade. They only for education purpose.
EURUSD Trend Reversal Trade
Nice Trend Reversal Trade on EURUSD. Banked +4.98%.
Trade Confluences:
-
Price is at the Major 4-Hour Resistance
-
Head and Shoulder Pattern indicate buyers are struggling to keep the pushing higher.
-
A break below the Local Structure Level indicates the sellers are in control.
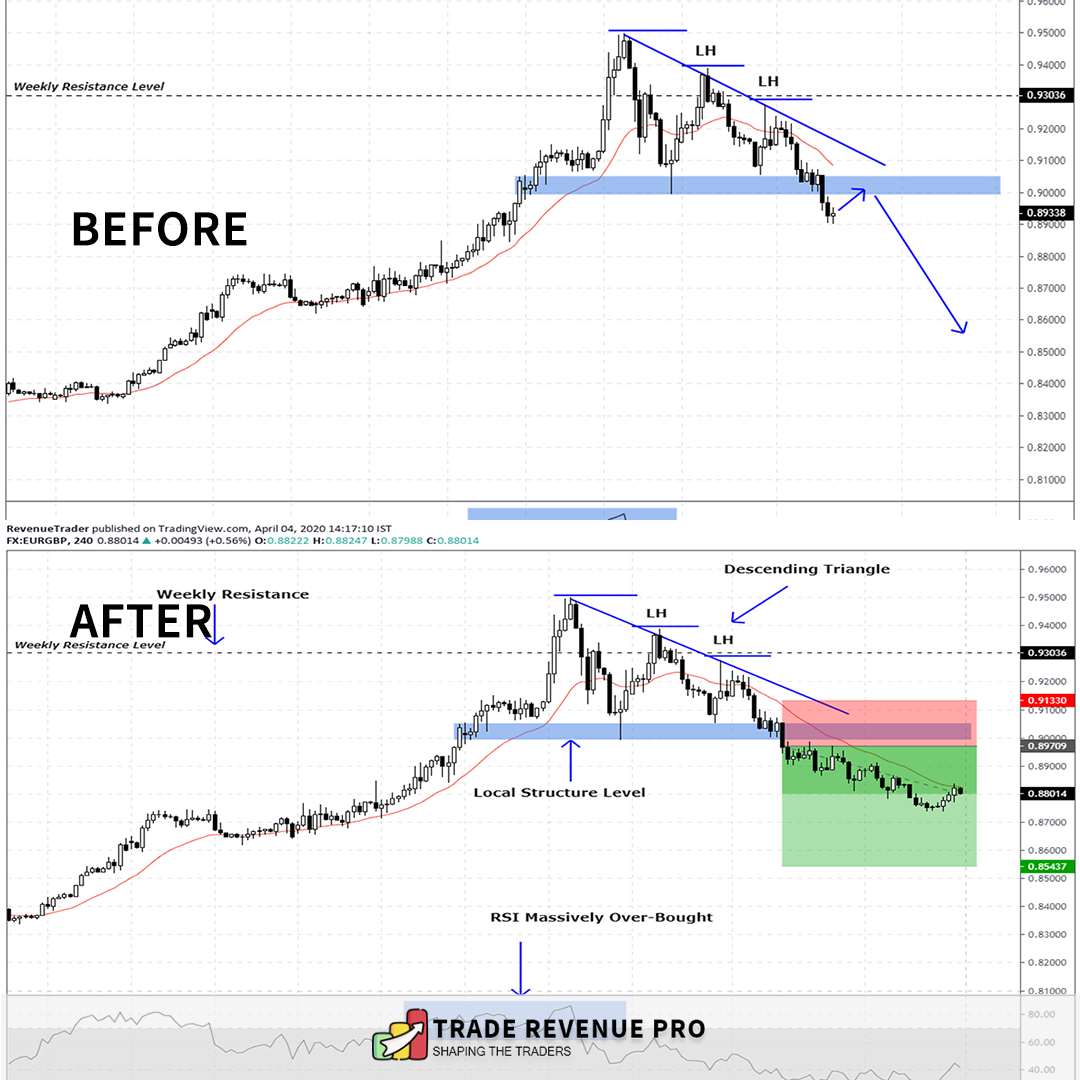
GBPAUD Daily Trend Reversal Opportunity.
If Price Broke Below the Local Structure Level (Blue Zone Marked in the Chart), We can expect a Trend Reversal.
Trade Confluences:
-
Price is Rejecting Weekly Resistance Level Three Times With Long Wicks.
-
RSI Shows Divergence
-
Price Broke Below the Trend line and Successfully Retest It.
EURCHF Trend Reversal Trade
Nice Trend Reversal Trade on EURCHF. We were able to book +4.9% on this trade.
Trade Confluences:
-
Price is at Major Weekly Support Level and this Level also works as a flip zone in higher time.
-
Then Price Start to Consolidate at the Support level. This indicates that sellers are no longer able to push price lower. RSI Divergence also confirms the weakness of ongoing downtrend.
-
And eventually, price broke above both trend line and consolidation. This signals us to go long on this pair.
Finally Here is the Before and After a Screenshot of this trade.
Our Trading Method is heavily is depend on RSI divergence and Key levels like support and resistance. By combining these two trading factor we can identify higher probability trend reversal trading opportunities consistently.
If you like to learn how we trade rsi divergence in forex market there is great article on our blog about - How to Trade RSI Divergence – 4 Practical Entry Techniques.
Yet another Profitable Trade Opportunity in Last Month
EURAUD Sell Trade at Weekly Resistance
Price Reject key weekly level and then start to move lower. That creates bearish momentum on this pair and as price approach to the local structure level, the bearish momentum starts to getting stronger and stronger. This indicates a potential bearish trade opportunity on this pair.
Trade Confluence
-
Price Reject Weekly Resistance
-
RSI show extremely overbought signal
-
Finally, price broke local structure level strongly.
EURUSD Trend Reversal Trade - (+6.82 Profit on EURUSD)
This is 2-Hour Chart of EURUSD and at the start of this week price struggle break above the Daily Resistance. All of a sudden price starts to move down and this indicate me reversal trading opportunity on EURUSD.
Trade Confluences
- Price Reject Daily Resistance Level
- RSI extremely Overbought
- Price Broke Trendline
- Finally Price broke below the local structure Level.
Here is the Trade,
AUDNZD Double Bottom Reversal Trade - (+3.6% Profit on AUDNZD)
This is the 1-Hour chart of AUDNZD. Double Bottom pattern at the daily support and the RSI divergence is what triggers us into this trade. Just like the previous trade, we entered the market as price broke above the local structure level
Trade Confluences
- Price Reject Daily Support Level Twice
- Double Bottom at Support
- RSI Divergence
- Breakout to the upside of the double bottom
Here is the Trade,
CADCHF Ascending Channel Breakout Trade (Reversal Trade) - (4.5% Profit in CADCHF)
This is a 2-Hour trade on CADCHF. We executed this trade as price break below both the ascending channels and the local structure level.
Trade Confluences
- Ascending Channel - This indicates the lack of buying pressure
- Price Struggle Move Above Daily Resistance Level
- RSI Divergence
- Break Below the Local Structure Level
Here is the Trade
November Third Week Trade Ideas for GBPUSD and USDCHF
Disclaimer: Trade Revenue Pro’s view on the Forex Charts is not advice or a recommendation to trade or invest, it is only for educational purposes. Don’t Blindly Buy or Sell any Asset, Do your own analysis and be Aware of the Risk.
GBPUSD - Head and Shoulders Pattern at Resistance Level
Trade Idea - If the price breaks below the local structure level, then we will consider placing sell orders after a successful retest of the local structure level. For take-profits we use 1.30044 marked area.
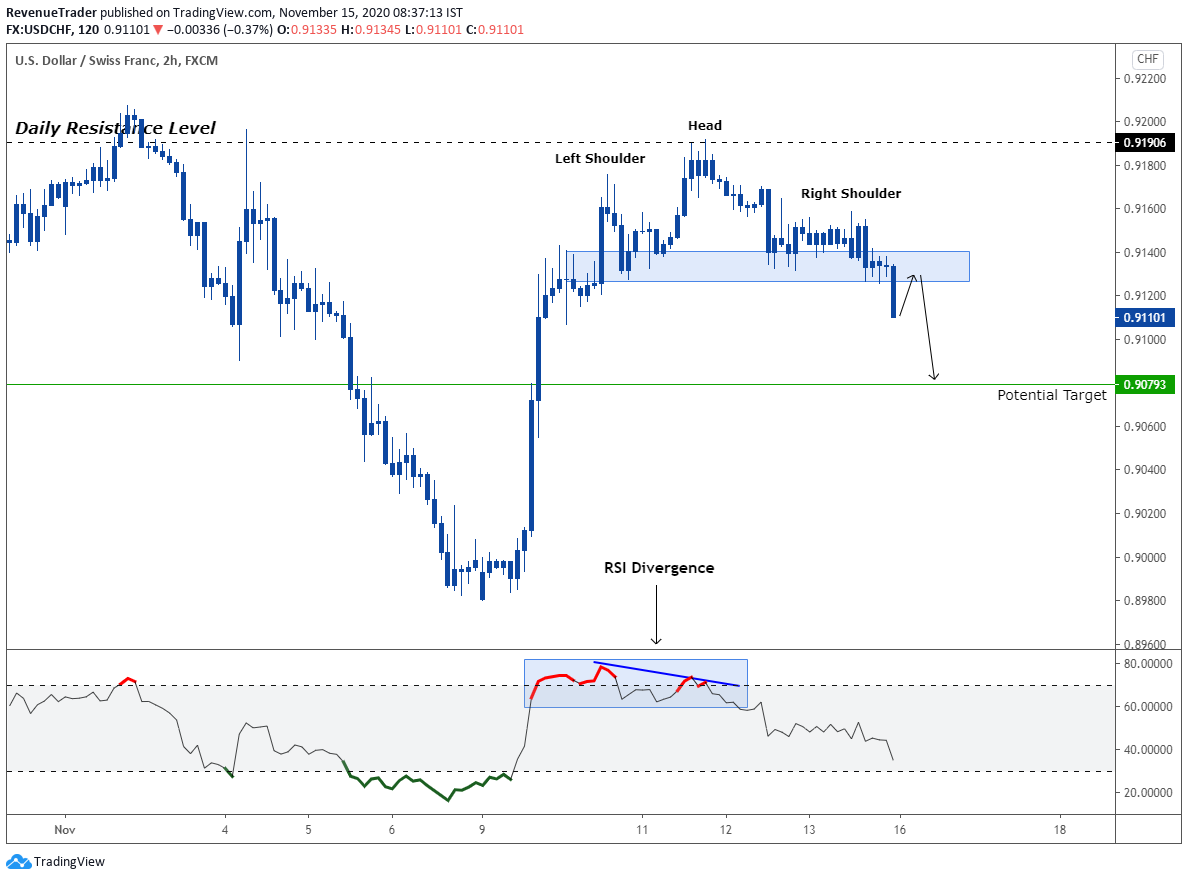
USDCHF - Waiting for a Retest of the Local Structure Level
Trade Idea - Break below the local structure level is completed. Now we are looking for a retest of the local structure to place orders. As for take-profit, we use 0.9079 level and also try to maintain 2R risk to reward ratio for this trade.
Want more Trade Ideas - Head over to Trade Idea Page.
All charts are accurate and error-free, thanks to this, I had about two hundred successful trades and I was in a big plus.