Hmmm I’ve seen a few threads and I’m intrigued to post my own analysis on what I plan to expect in the markets with a few pairs that I watch. I’ll post up analysis of the chart on Sunday and potential trade set-ups for someone or anyone watching. This is more to put my analysis down on something other than my trade journal.
4 Likes
What happened to your trading journal? I’m asking because you’ve put this thread under ‘trading systems’. Will you be explaining your strategy or is it just analysis and trades in which case it should probably be under ‘trade journals’ or ‘trading signals’.
Hello Trade,
Yes when I created my trading journal so long ago I was using a different approach at the time. Yes I’ll be explaining my strategy, my analysis behind taking the trade, and the trades that I plan on taking.
3 Likes
A public journal is a good way to stay disciplined, as long as you’re honest. It really makes you accountable for each trade, so you tend to be much more careful with your analysis.
I have been contemplating starting one here myself.
2 Likes
Nice, looking forward to see your insights. We need some clever guys here to explain technical analysis.
1 Like
Ok guys as promised - its Sunday and I’m ready to explain my strategy first. So I usually use the daily chart/weekly to look at the longer term trend and use 1HR/4HR for my entry points. Now I do have an MA, RSI, Stoch that I have placed on my charts. I don’t use the RSI & Stoch as much as I use too but I do pay attention when it’s showing overbought/oversold tendencies on the daily chart. Now I definitely use the BB bands the most just to let me know when it’s hit certain temporary resistance/support levels. You’ll see in some of the charts I’ll post how the pair will hit that upper band and come back down or vice versa. Obviously this doesn’t happen all the time but it’s happened enough in the recent months that I use it for quick short opportunities. I watch price closely when it’s hitting those lower/higher regions of the BB but I’m really following price action at the end of the day. What happens when a pair encroaches on a new price level? Does it pull back, does it blow through, or does it range? Obviously it can be anyone of these things and my job is trying to predict the next move so I can profit. This week the pairs I’m looking at USD/MXN, AUD/CAD, AUD/USD, EUR/USD, GBP/USD.
Bollinger Bands : 30, 2
MA : 20 / EMA : 10
RSI : 14
Stoch : 20, 3, 3
What I’ll usually do to start the week off is pretty much look at the calendar to see what’s going on for both pairs that I’m looking at. After that I usually write my analysis in the charts and levels that I have for both a BUY/SELL positions. Usually I’m a fan of just staying with the overall trend and not going against it. I like to think my strategy is pretty simple so let’s get to actually explaining how I embark on a trade usually.
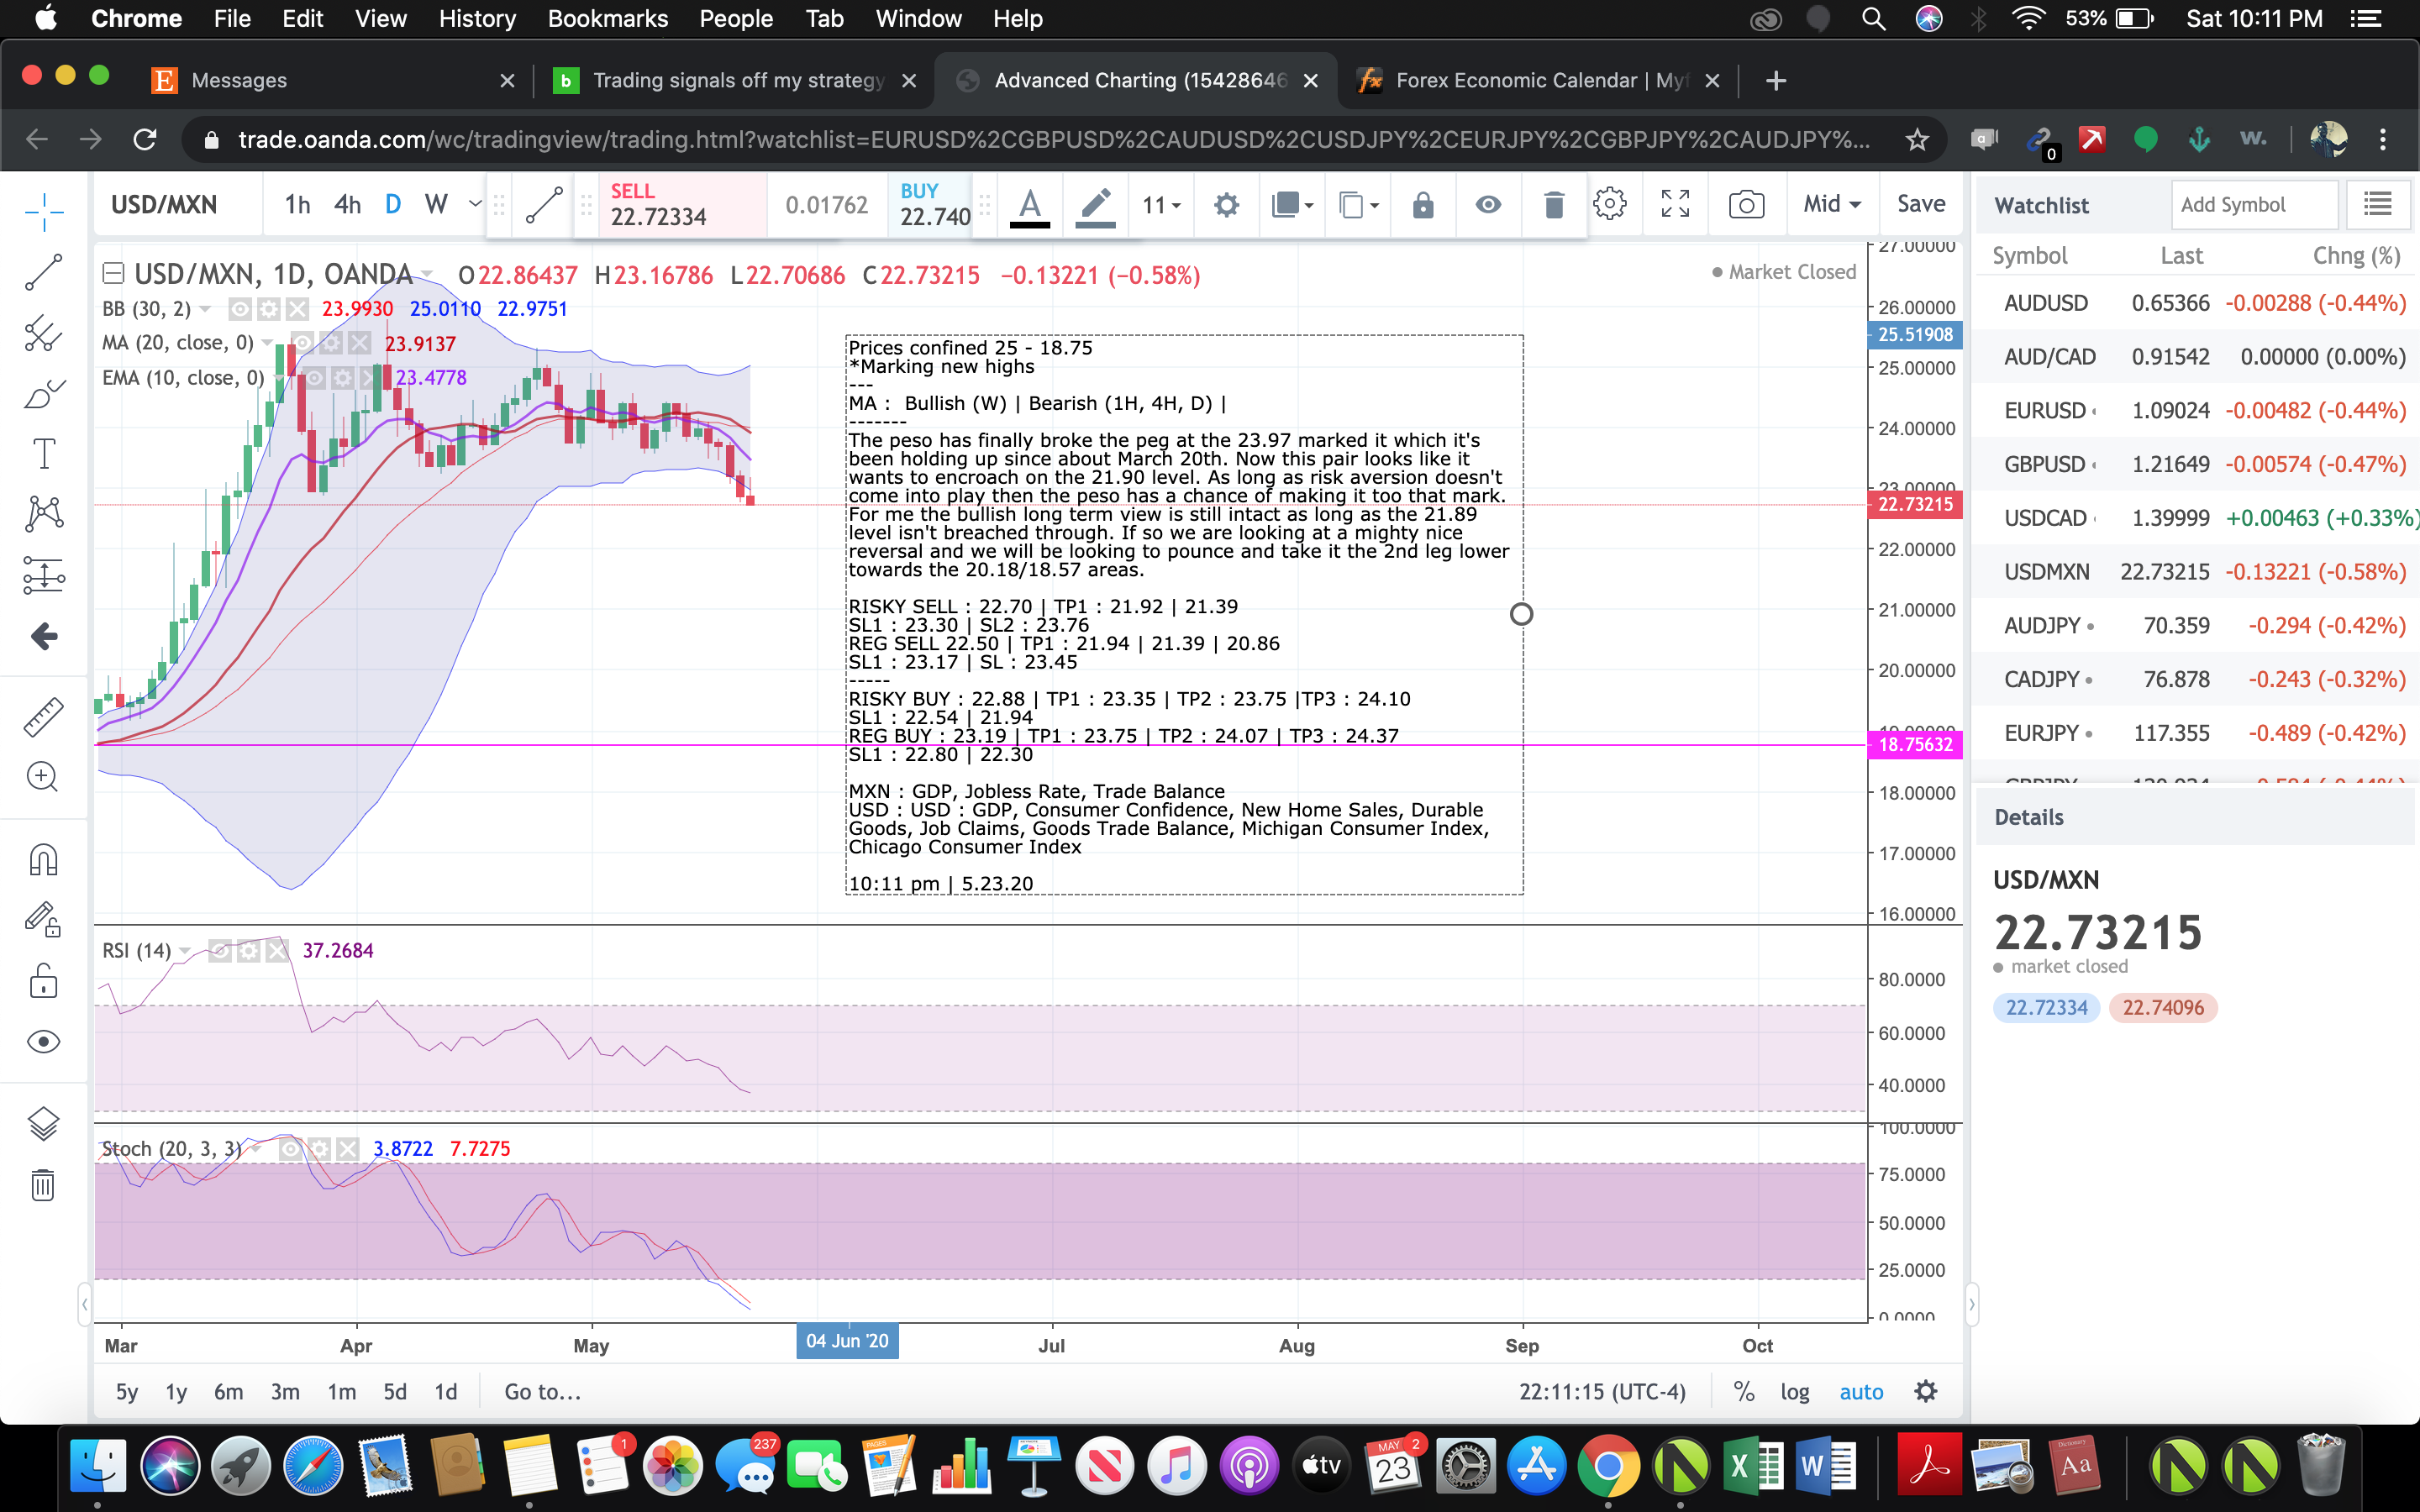
Let’s use my USD/MXN chart just to explain how my thought process works when trying to view the charts. It has peaked twice when hitting that mid 25 region trying to break through to the 26 level. Now that 23 region has held up since March 20th and for me as long as this stayed above this price the move could further go back towards 24/25. Now in the last 2 days it’s finally broken that handle and it looks poised to hit the lower 22 or 21 handle. For the BIGGER PICTURE I would say this is simply a retrace and unless it breaks past the 21.90 handle this pair is prone to go back up. Now I also factor in what’s happening on a global level. Right now with any type of risk aversion acceleration this week you can probably expect the peso to weaken. It’s pretty interesting a bunch of commodity pairs had weakened against USD the past week but peso happened to remain resilient.
So what would I do with this type of outlook for USD/MXN? In my opinion I would sit out as the pair is in what you call “no mans land”. This pair could go lower trying to go on a bearish reversal or looking at the long term picture it maybe a slight retrace and a bounce back higher. It also could be ready to range again as it has done for the last few weeks where it’s been confined to the 23-25 zone.
Basically I keep an open view on all sides. Because a pair can really only do 3 things which is range, go up, or go down.
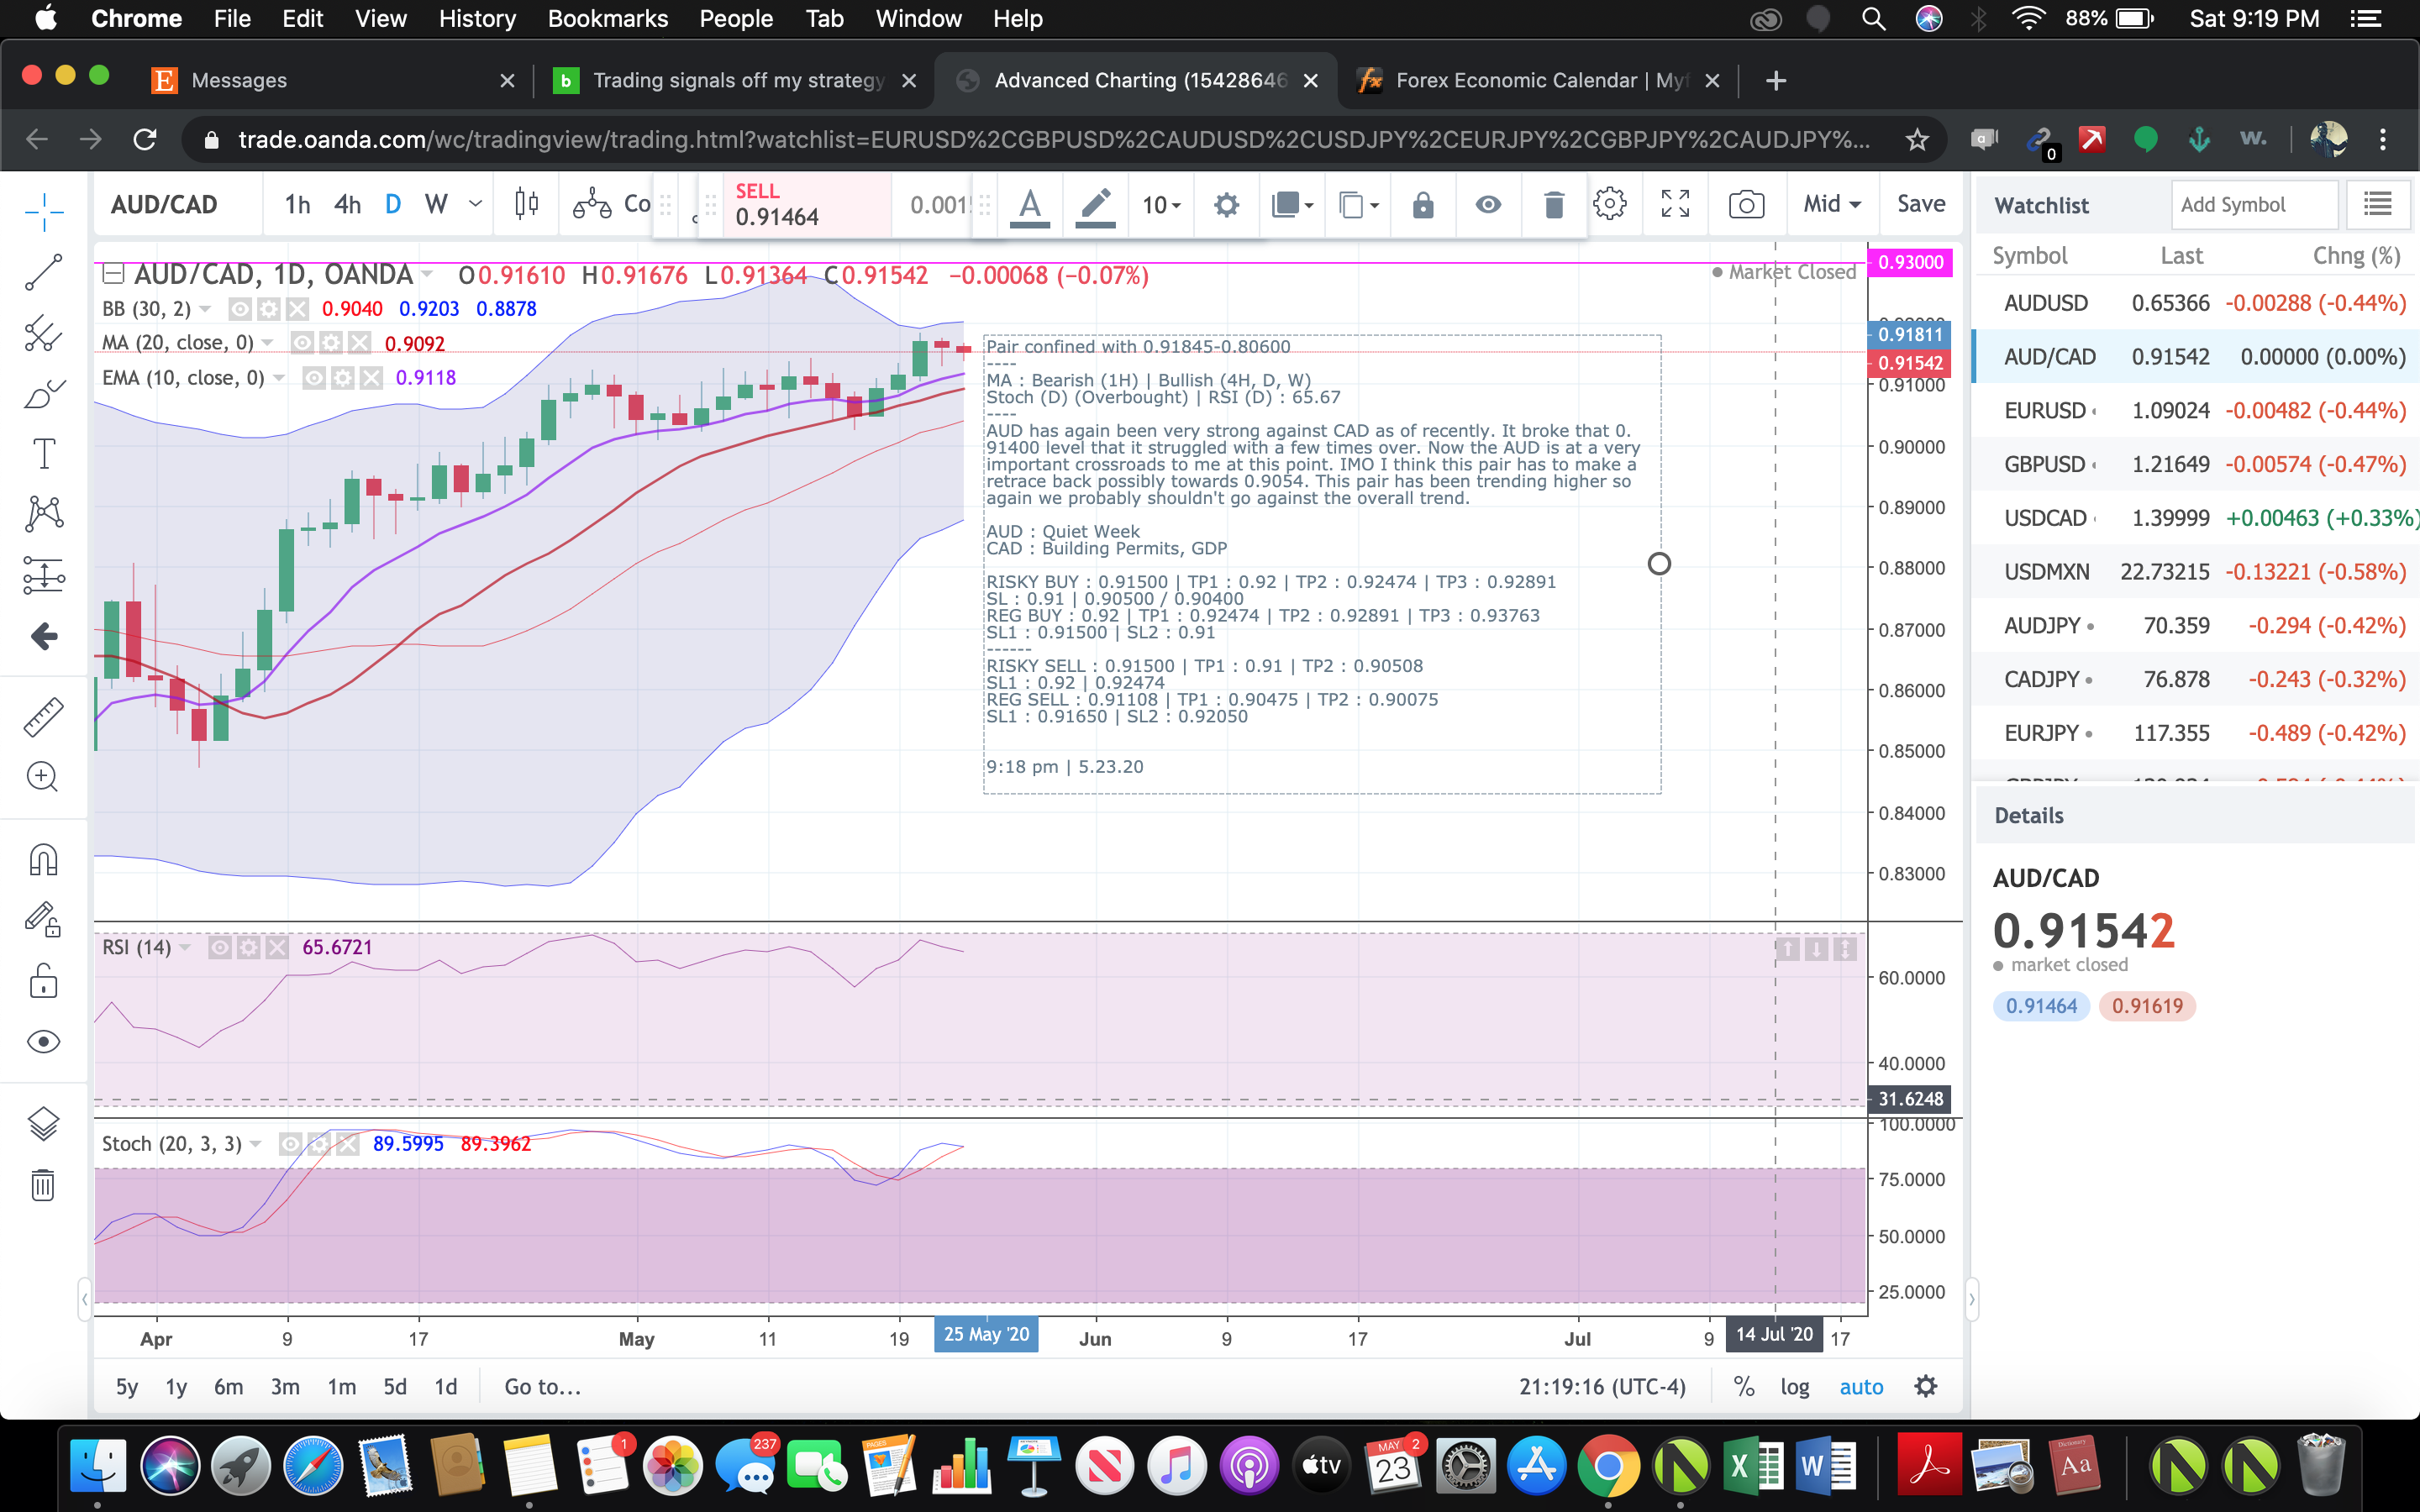
As far as entries I have 2 types : I have entries on the 1H/4H those are for short trades. Trades I plan to hold for the week or less. The trades I place on the D/W charts are longer term trades and they can be open from weeks to months at a time. Also I’m giving you analysis on 5 pairs but in my own trading I usually stick with 1-2 pairs for the week. So for example, if the AUD/CAD trade happens to open first before the others that’s what I’ll usually focus on until I close out the positions. I hate to be jumbled down with multiple positions it makes me lose focus pretty easily.
If there’s anything I need to explain further or clarify just let me know.
(P.S) If the trading signals are too small for you to view in the charts just let me know and I’ll edit the post and write down the actual numbers.


2 Likes
Hello - starting off the trading day. I didn’t place any orders last night which I should’ve since some of these trades would’ve triggered and be up in profit but who cares it’ll eventually come back down again for better entries.
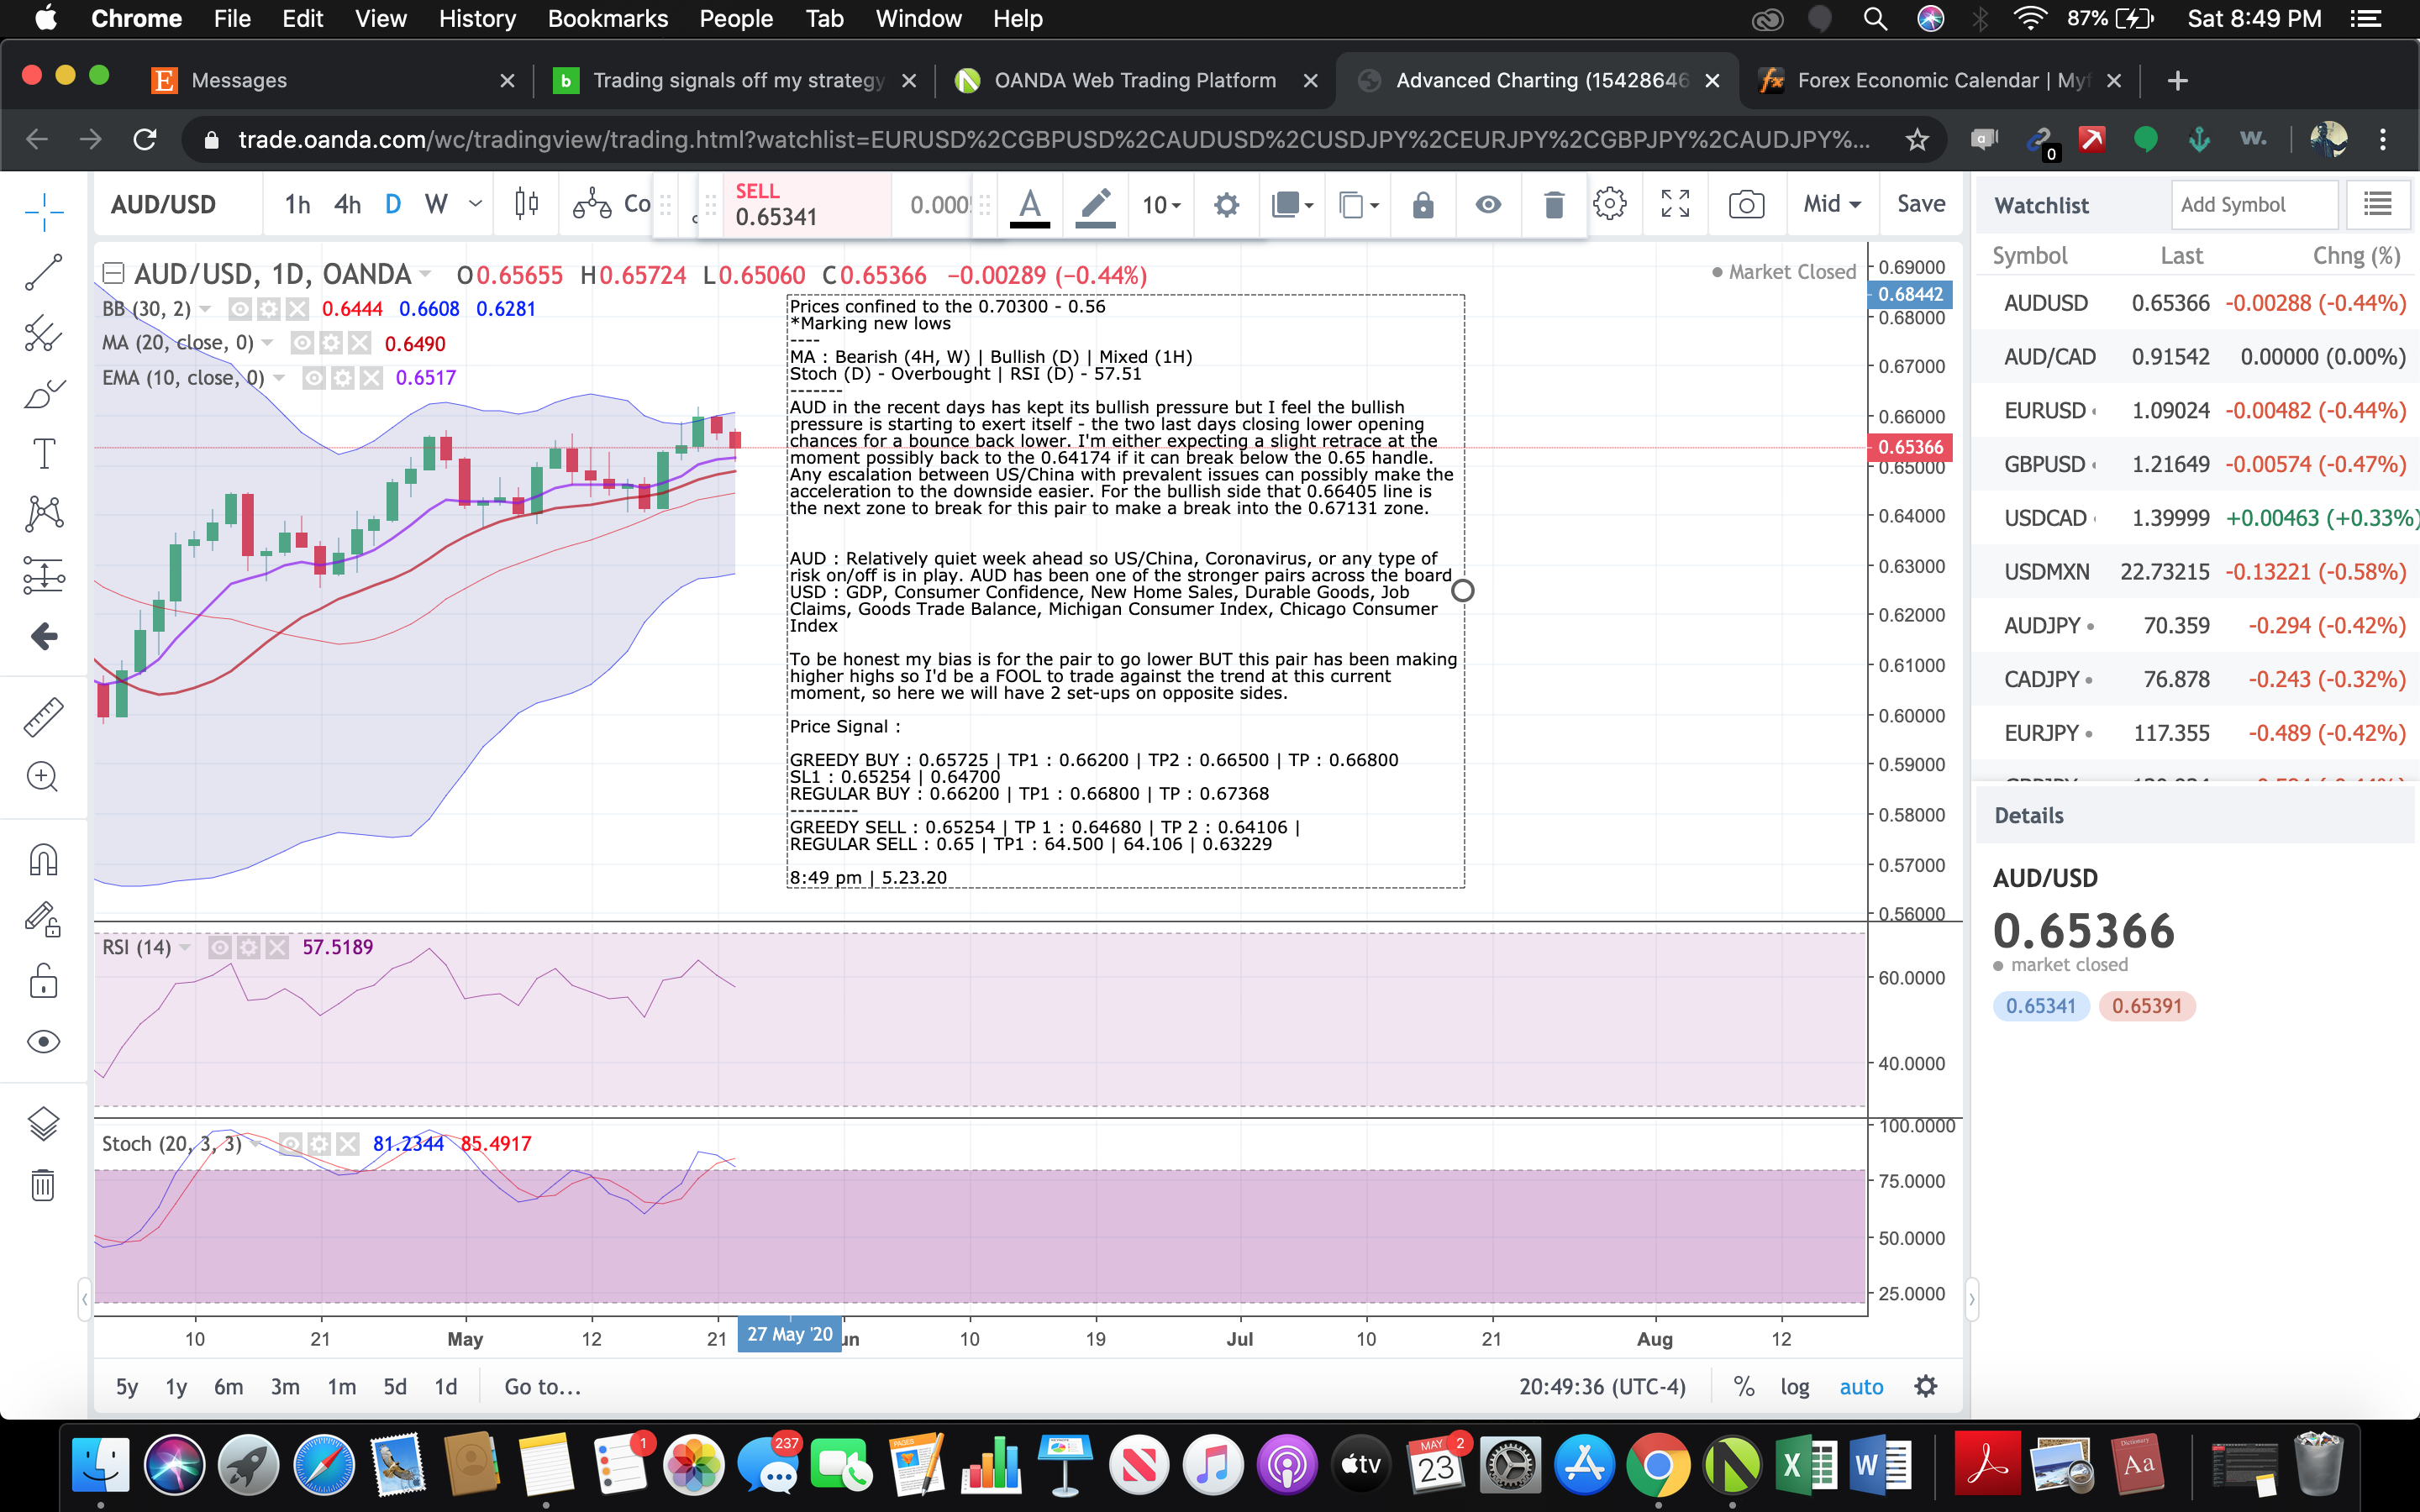
I was wrong on the EUR/USD & GBP/USD aspect for the start of the week as risk on has resumed but I think this will be short lived real soon. USD/MXN & AUD/CAD will keep me occupied this week. I’m kind of the fences of even placing a trade right now I’m kind of waiting for all this optimism to die down a bit so I can paint a clear entry for myself.
Hello, Do you rely on the intersections and the peak of the selling and buying Stockhastic and the FRI of the deals? Do you always give you the most wonderful checks for the most likely explanation?
Stochastics & RSI are there but it’s more background noise to give me any indication of oversold/overbought levels (I take it with a grain of salt as it can easily push itself into oversold/overbought territories for a while).
I’m looking more at when prices hit the top part/lower part of my bb band and what has happened recently when prices went to those areas. Did it stall and come back down/or go back up? Did it break through previously just to revisit? Then I look at the bigger picture and see what’s the overall trend. If the overall trend is long then I’m looking for a good entry and vice versa when I’m shorting.
I did not understand you ?
You see where I put the rectangles - I’ve been watching what price action has been doing since it’s been confined to that range since March. It’s basically been ping ponging between 22.90 - 25.73 / anytime prices hit that upper 25 area it came back and retreated so I looked for shorting opportunities at that area. Anytime prices had hit the lower 23 area I’d be ready to go in for a buy. This is only for now as the pair has been ranging at these levels for the past 2 months. I’m basically watching what price areas a pair encroaches on and what happens after it does that. Do you need me to still explain a bit further?

Explanation of how to enter a buying or selling. When do the indicators reach the buy and sell peaks?
I use the indicators more to confirm my outlook on the longer term trend. As long as the longer term trend is buy I’ll look for places to buy the dip when the pair retraces and vice versa when I’m short.
Look at the chart for example that I posted previously in the blue rectangle. You see price hits that 25 region and reject it. I would’ve opened a short the second time it came back in the area (where the red candle with longer upper wick is). The next or last opportunity again would’ve been the green candle which slightly touches that region.
The indicators are used more to just confirm the direction I think the market is going - I place my entries via price points. Since I seen 25 seem to be a hard resistance for this pair to crack when it touches 25 I would place a sell order. If the pair had touched the 22 region and held support I would be looking to get in long. Remember a lot of these areas I’m referring to are just simple price areas. So we could be at a certain price for a while or move through it quickly. All I’m looking to see mainly is what price levels as of recent the pair struggles and when it struggles what usually happens.
Do I need to clarify a bit more?
No, you may use methods, but they are yours and you only understand them anyway
I understand I just want to be able for people to understand how I look at a trade and I how I prepare for entries.
1 Like
Thank you for the informations
1 Like
Didn’t take any trades last week. Hoping to plot a bit later and possibly put some entry trades in the system. Kind of slowing down since I already hit what I wanted for this year. Will be looking more at commodities. Probably looking to take a trade or two a month going for some maximum pip movements.
Deals were lost last week, but they are still open until now. The New Zealand dollar is hoping for a drop against the Japanese yen and the US dollar.
Yeah I don’t like really trading the markets when there’s a disconnect with reality. Too much baked in optimism but reality has yet to set in. I’m potentially thinking of a AUD long since it’s been just resilient as hell. Not sure though if I can get it at an ideal price then I don’t mind.
Only looking at one potential set-up and it’s USD/JPY because it’s just been stuck within a range between the higher 108/107 range. So I’ll look to short from 107.9/8 levels to lower 107 and vice versa.
That’ll be the only trade I’m considering taking this week.