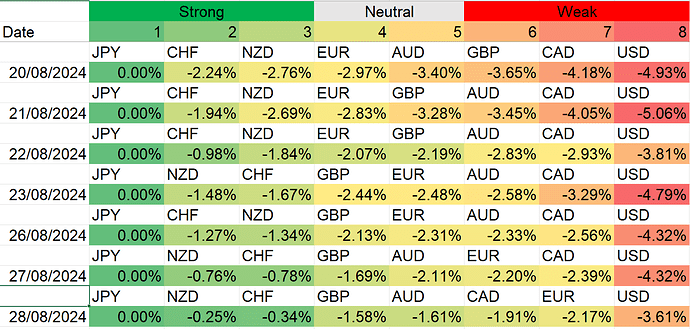
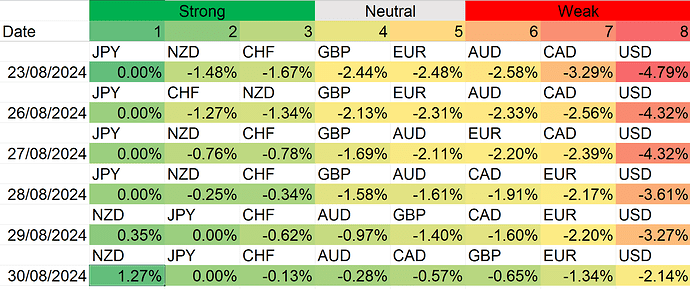
Not much change. Low volume yesterday.
Not much change. Low volume yesterday.
August Bank Holiday in the UK.
hello everyone i came across this thread the day when Dennis announced that he will be absent and is going for hike. don’t know if that was a bad omen for me.(to not trade). ![]() . but anyway i went through the thread from the beginning to understand how it works. and I got it.
. but anyway i went through the thread from the beginning to understand how it works. and I got it.
When i was going through the thread, i saw that the strong weak really give you some pips).but its been like two weeks and the strong weak is not doing any thing. So I wanted to ask some senior traders here that is it me as newbie feeling that market is not moving? and is in like consolidation phase? or is it really like that. Like what is Happening?
Thanks
More Pips to you all.
You just joined August 4, 2024.
Have you completed the BabyPips FX School?
Assuming that you also just started trading, this is not the thread for you, IMHO.
Signals are few and far between; there are no definite rules, so there is no defined system here.
Good Luck
I am undergraduate senior so about to graduate
I would have graduated by now but I started reading this thread along with graduation. I read around 1000 posts from this thread to understand the dynamics.
I started reading it because I already had the idea of trading strong with weak but not in depth but thanks to Dennis and his thread (to you all),I got more information.
also I started in start of July.
But anyway thanks for your reply.
Agreed with FOK, do the BabyPips FX School and develop your own system.
The SWA analysis isn’t a strategy it’s merely a barometer to help frame your trade.
I try and trade in the direction of a short-term trend (days to weeks) using standard TA, and the SWA analysis is one of the tools I use to see where the buying / selling pressure is focussed.
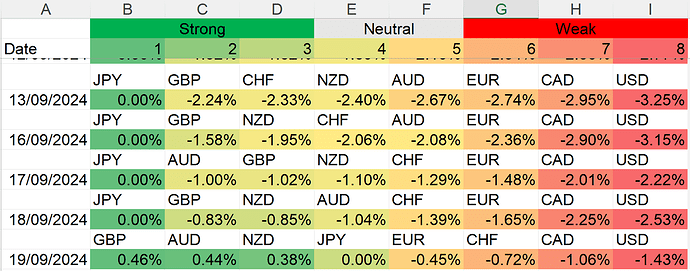
The table helpfully posted by @Emorgan90 is a very “normal” currency table. So what is “normal”? -
- AUD follows NZD
- EUR is weaker than GBP
- CAD is USD
- GBP lives in the mid-field
- JPY does the opposite of USD
Be cautious of a table which does not reflect these associations, especially if your trades are anti-normal as a result.
Hi, A golden Tip by @tommor, thanks
Going on holiday now for few weeks so won’t post SWA
USD weakness continues, still some big news these last 2 days of this week.
The USDJPY according to my way of monitoring this method.
New top trade GBPUSD. Fundamentals are strong here. Central bank divergence between BOE and Fed. BOE standing pat and not raising rates at their recent meeting. Rates markets only pricing in ~50BPS of cuts before end of year, compared to the Feds 100BPS in the FOMC dot-plot.
The bond yield differentials support this and the difference between the UK and US 2 year and 10 year spread widened by 2BPS and 8BPS respectively.
what happaned to strong weak analysis???
Hi, Mr Dennis is still on vacation.he posted that…


