I opened an account with FXCM in late 2015 and the largest draw-down I incurred was -30% (this wasn’t very long ago). It’s now time to work it up back to break-even. I had three great trades last week where I made 10% and reduced my drawdown to -18.5%. I started with $1,000. To figure out how much is in my account now, you are free to do the math. I am all about transparency here, and I do not intend on making claims about trades that never happened. I will always show proof in the form of screenshots in order to amplify my desire to be as transparent and honest as possible, both to myself but also to any potential spectators.
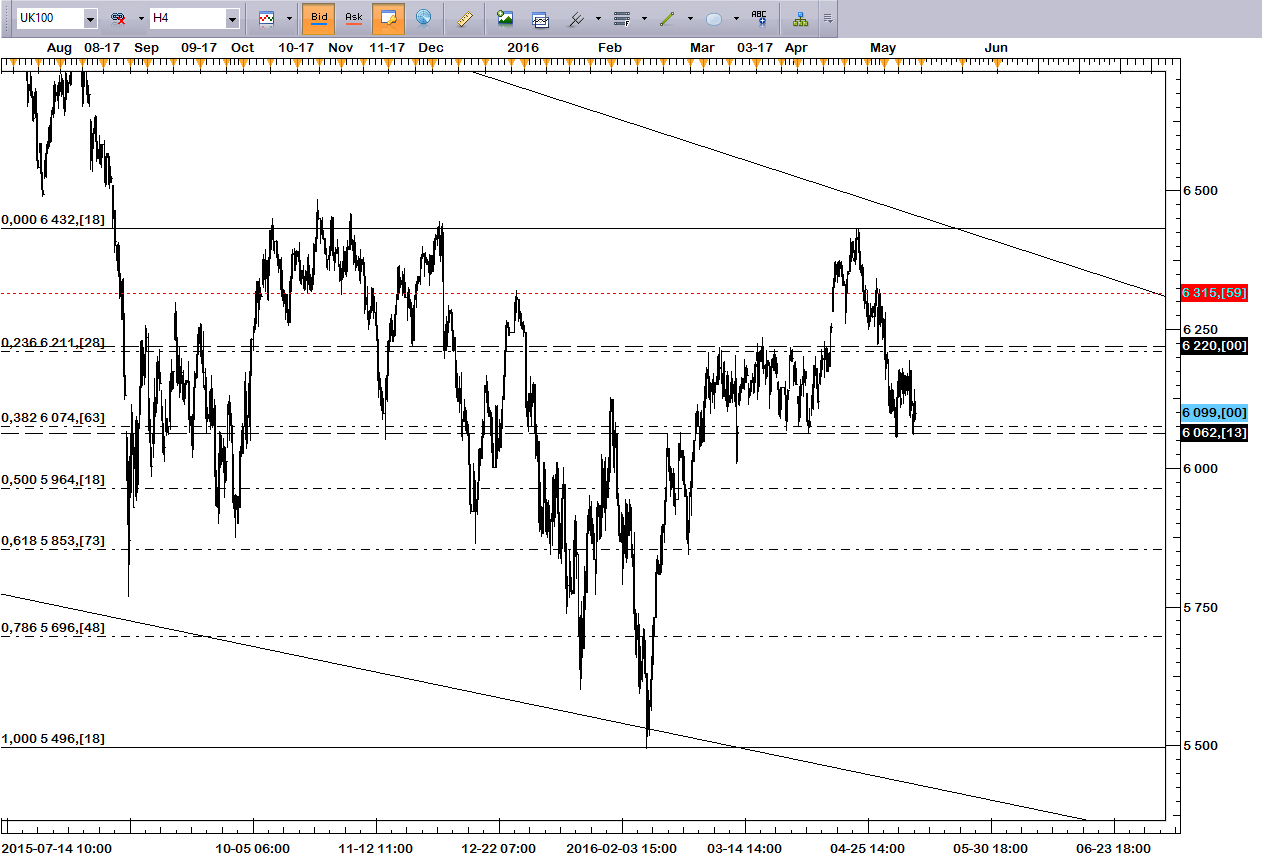
This week I am looking to trade the following markets: GBPUSD, USDCAD, UK100, ITA40, Copper & NGas.
I will post charts of my analysis as I take the trades. However, here’s a preview on my GBPUSD analysis:
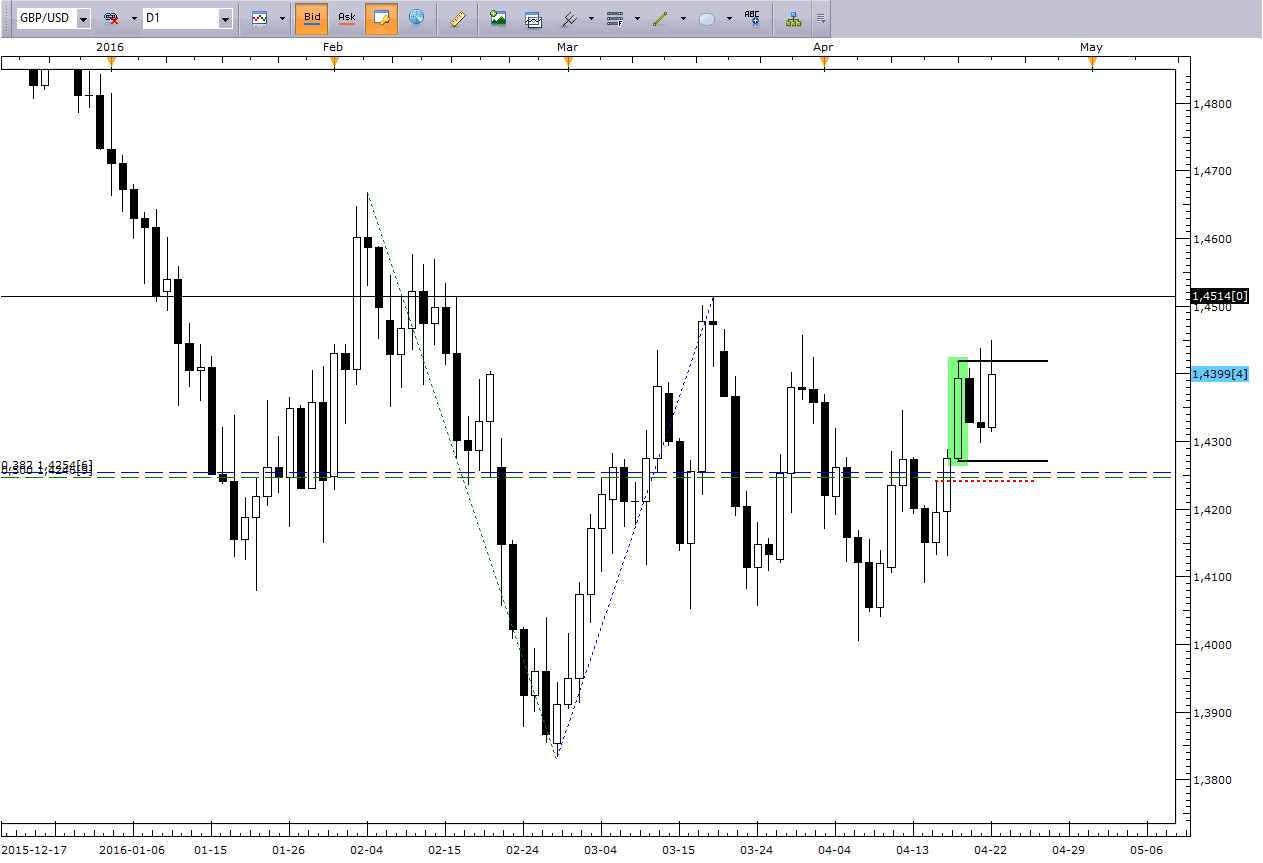
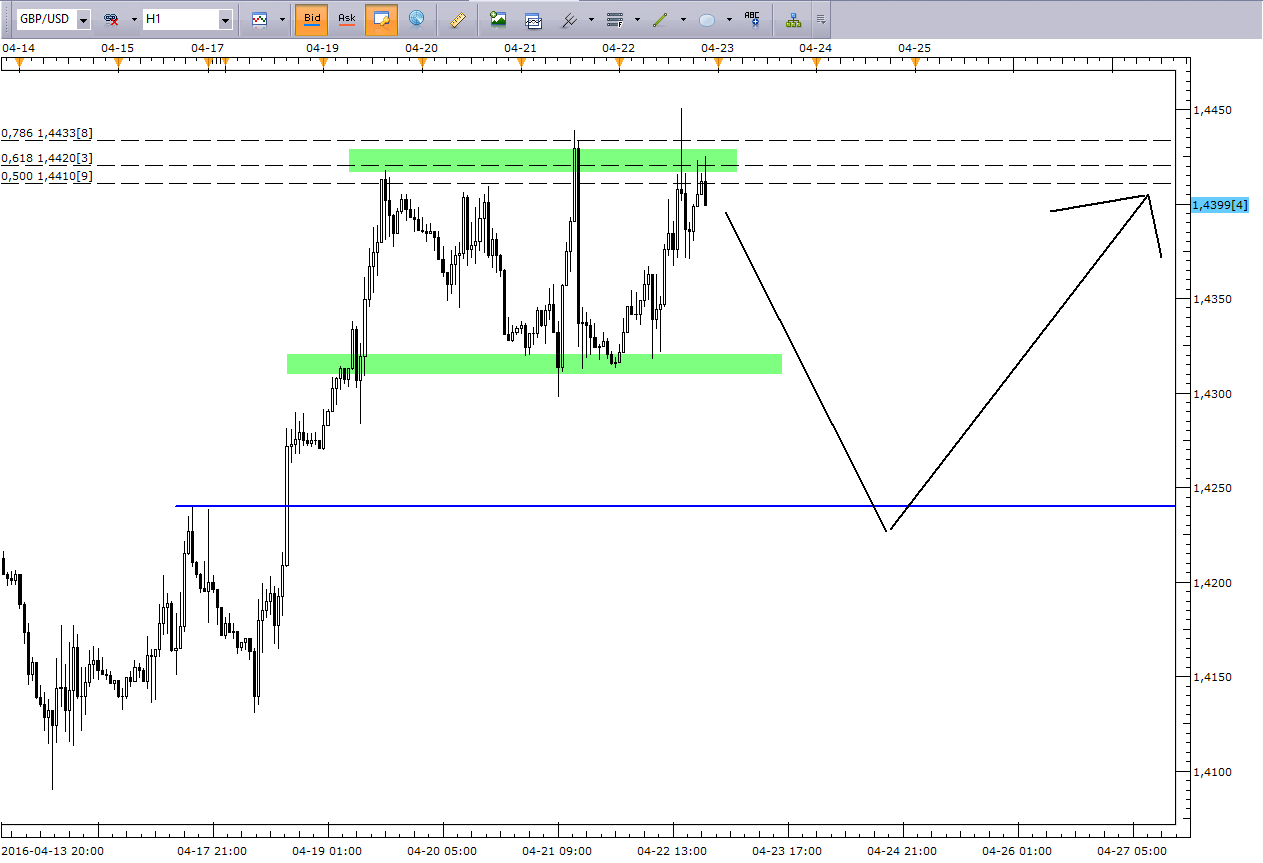
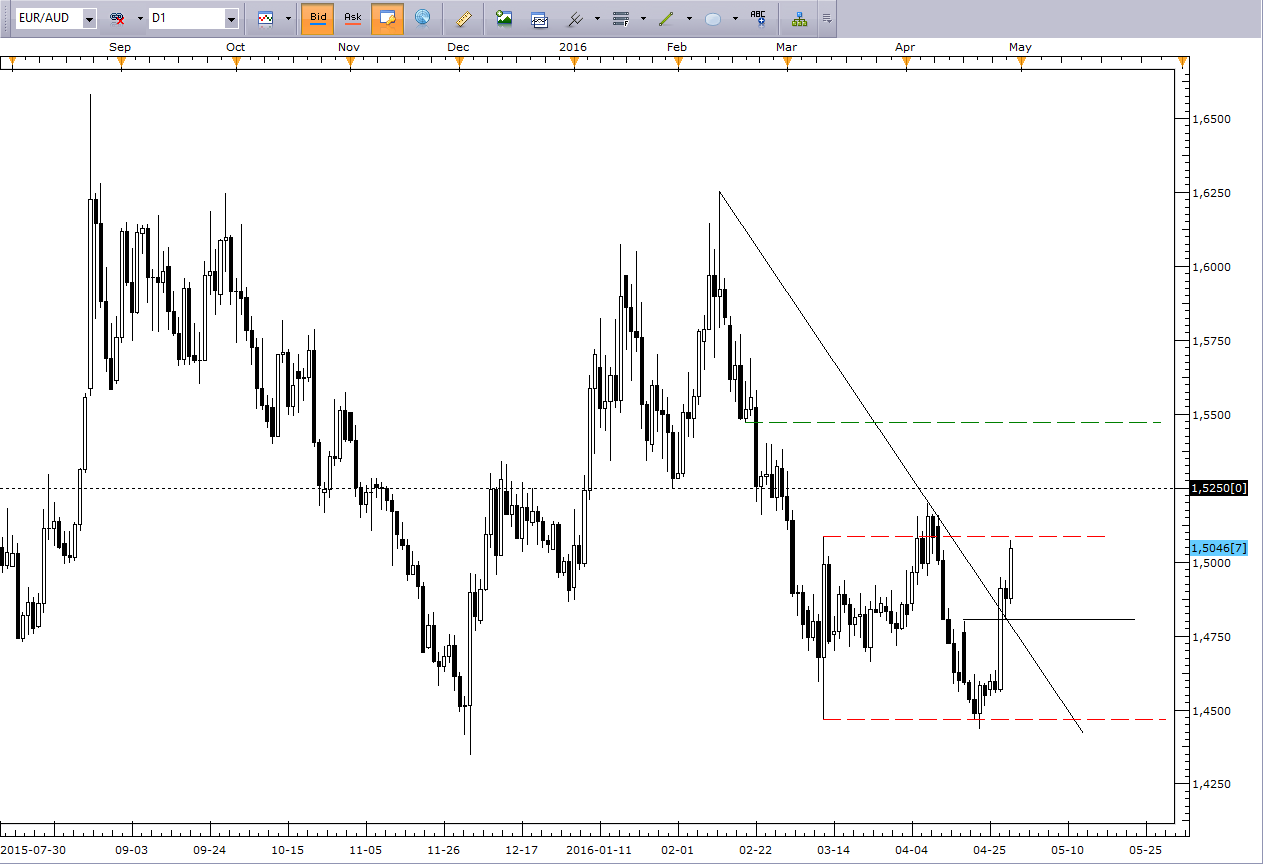
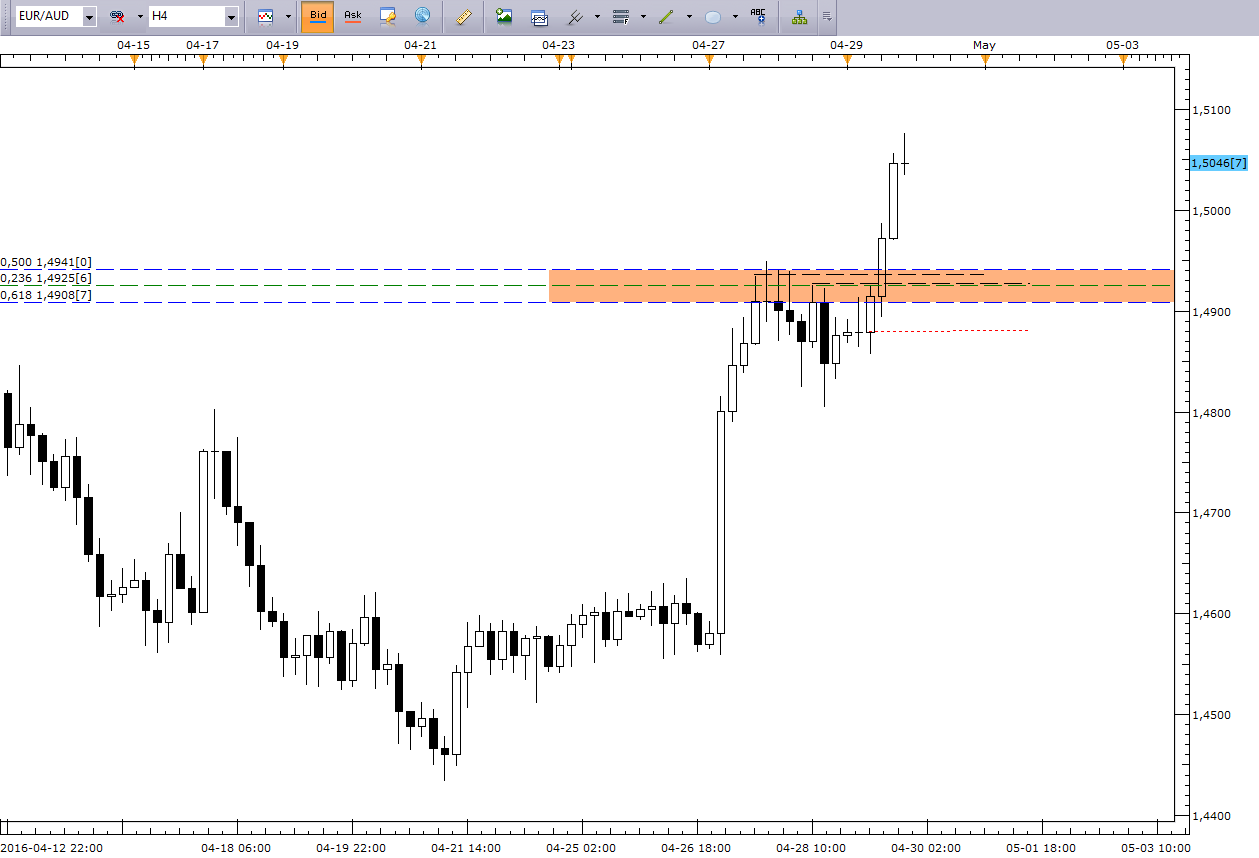
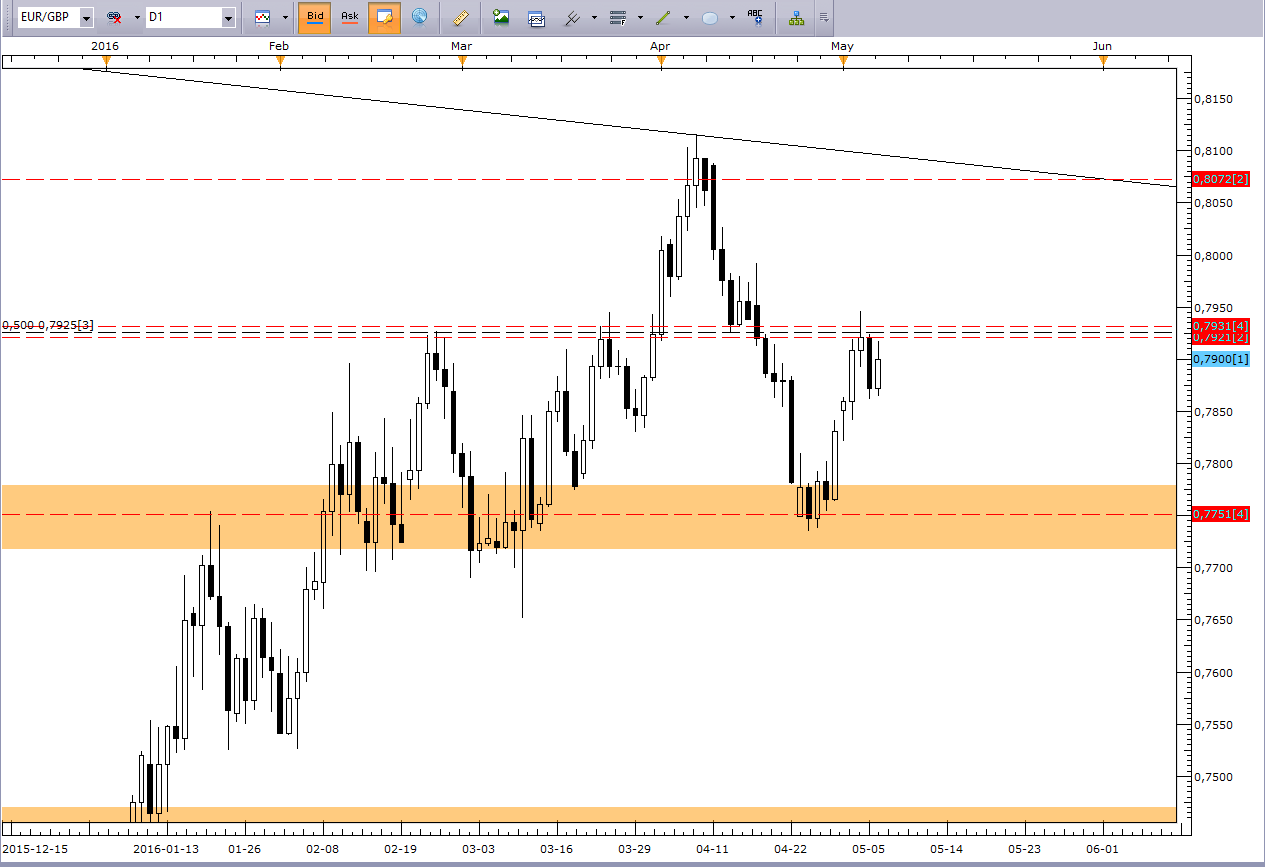
Starting off with the daily chart, we see that the market has tried to break and close above the high of the bullish candle highlighted in green. That is an indication of the market’s desire but inability to break higher. Why is that, you ask? It’s actually quite simple, and we’ll see why in just a minute. First of all, we have to get two things settled and out of the way. Firstly, the market has a tendency to sometimes pull back to the last high before a strong move to the upside. On the above chart, that last high has been marked with a red dotted line. Secondly, if the market breaks a support/resistance level without re-testing the level as resistance or support respectively, it is likely to return to that level at a later date. Let’s have a look at what I mean:
Do you see the high marked with a blue horizontal line? Do you see how the market just smashed through that high without re-visiting it? This essentially indicates to us that there is a lot of liquidity at that level (because potential longs from that area after the breakout were never filled) and thus, we want to wait for the market to hit that level before we get long. Less advanced traders are likely to try to buy up the support level around 1.4300 and get caught in a losing long position until the market hits the blue horizontal line and then rallies.
I’ll be putting my money where my mouth is. I’m going long with a pending order at 1.4242 and placing about a 64 point stop. The idea is to see the market rally to the 1.4500’s.
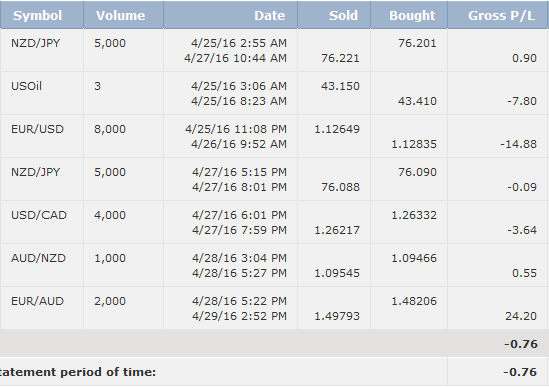
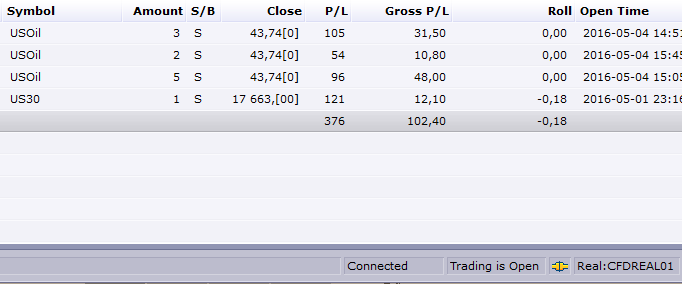
Alright, so it’s time for the ole Sunday review! I ended up taking a number of trades this week, seven to be precise. Three of those were losers, three were break-even and the last one was a decent win which covered the losses of the three losing trades. Unfortunately my charts were lost and I didn’t back them up, so I don’t have anything to show for. However, here are the statements:
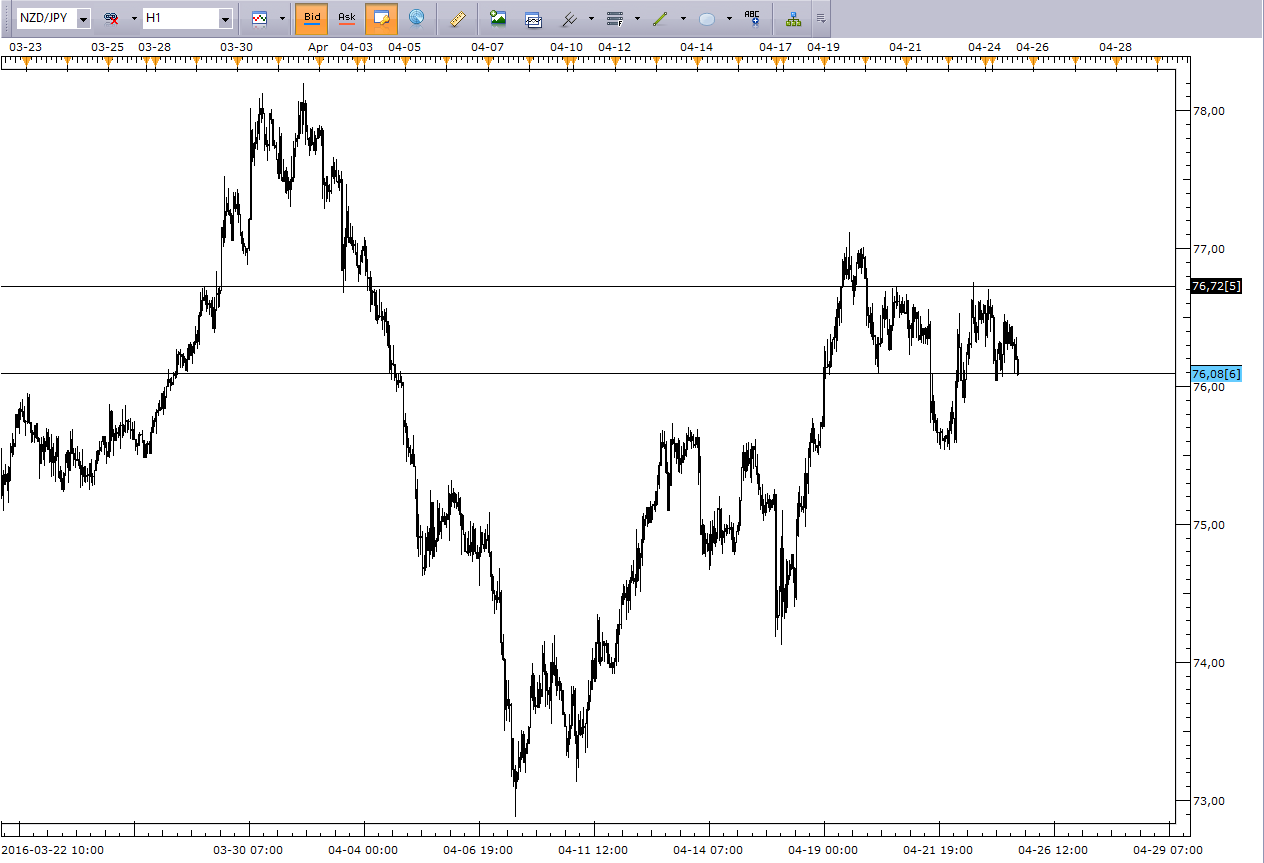
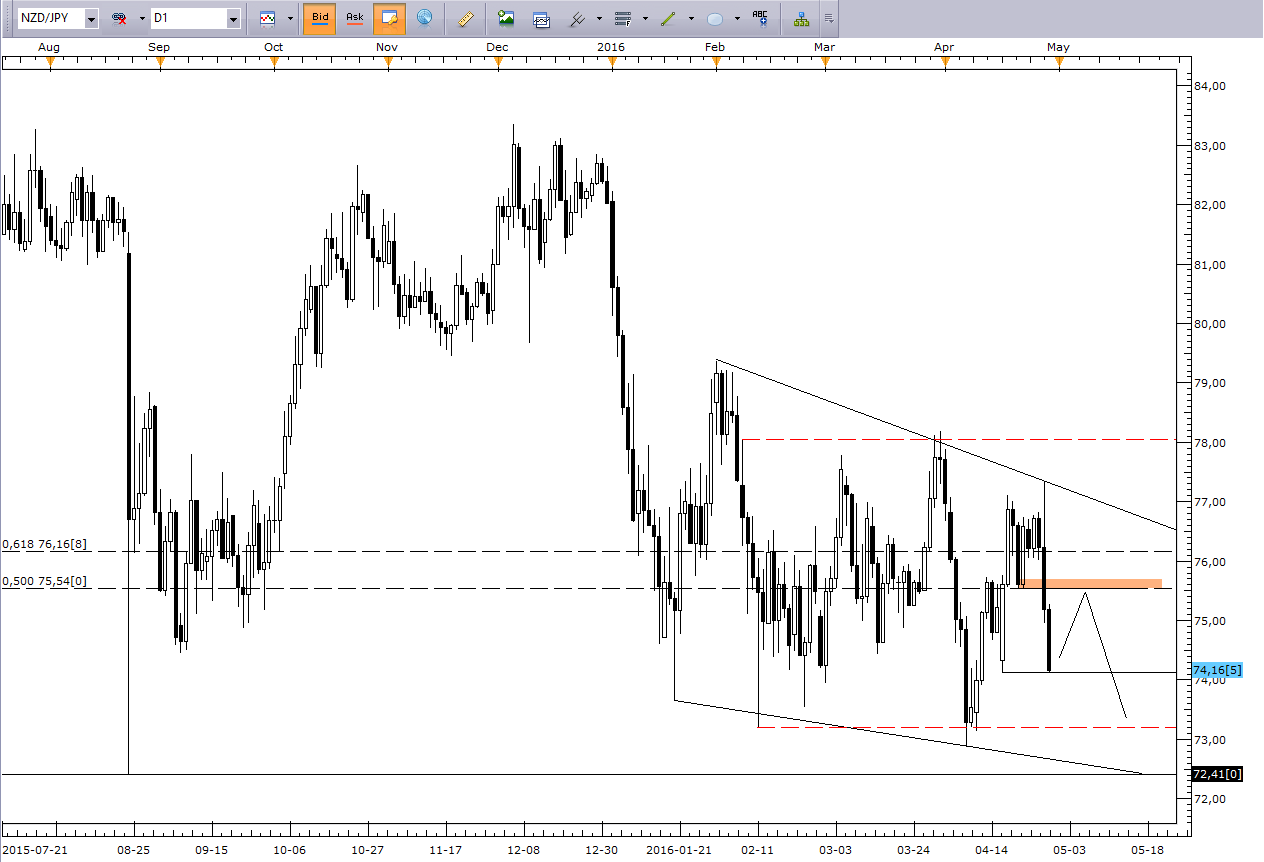
As you can see the amounts aren’t huge, but keep in mind that most of those trades were what I call ‘**** it trades’, which means I knew I shouldn’t risk too much on them. I hadn’t conducted proper analysis before taking the trades. However, I stuck to my plan on EUR/AUD and it saved me with a good risk:reward ratio. I decided to adjust my stop on NZD/JPY to break-even (which my plan clearly states I should not do) which got me stopped out. What happened next? The market rallied to my target and then fell off. If I had kept my stop where it was supposed to be, I’d have gone out for a profit. The yen strengthened and appreciated against a number of currencies this week, but despite that I managed to set a sell limit order in right before the market turned around and went down. I was wrong, but my initial plan would’ve made me money regardless. I think that’s an important lesson.
For the coming week, I have a few setups I’m looking to play:
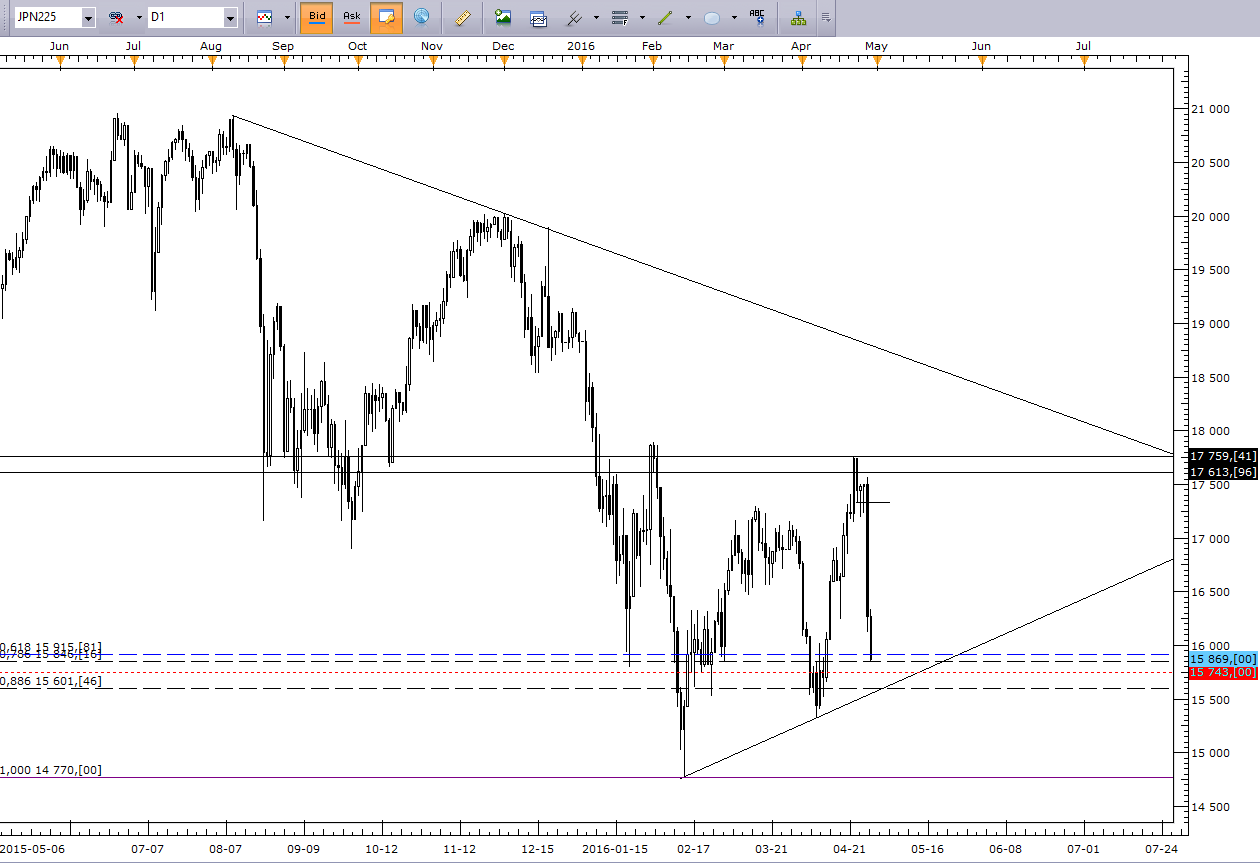
I’m looking to buy up JPN225 from this area around 15 750. We have lots of confluence including dynamic support (moving averages) and fibonacci retracement levels:
The answer is simple - with my own trading plan! I decided to come up with a key few setups to look for and I decided to ONLY watch out for those. I found something like that forming on a couple of pairs and decided to take the trades without moving my stop-loss or target-limits and lo and behold, the market did its job and I cashed out!
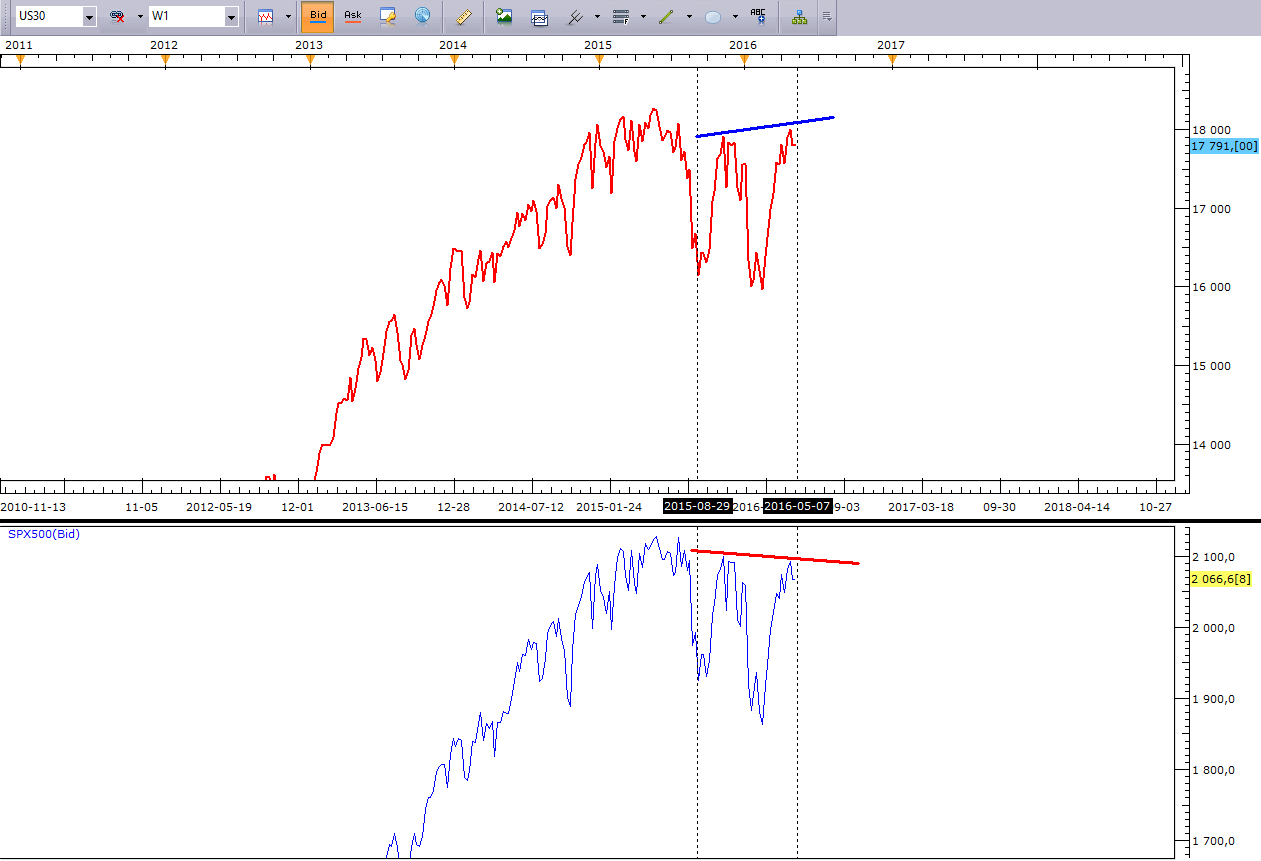
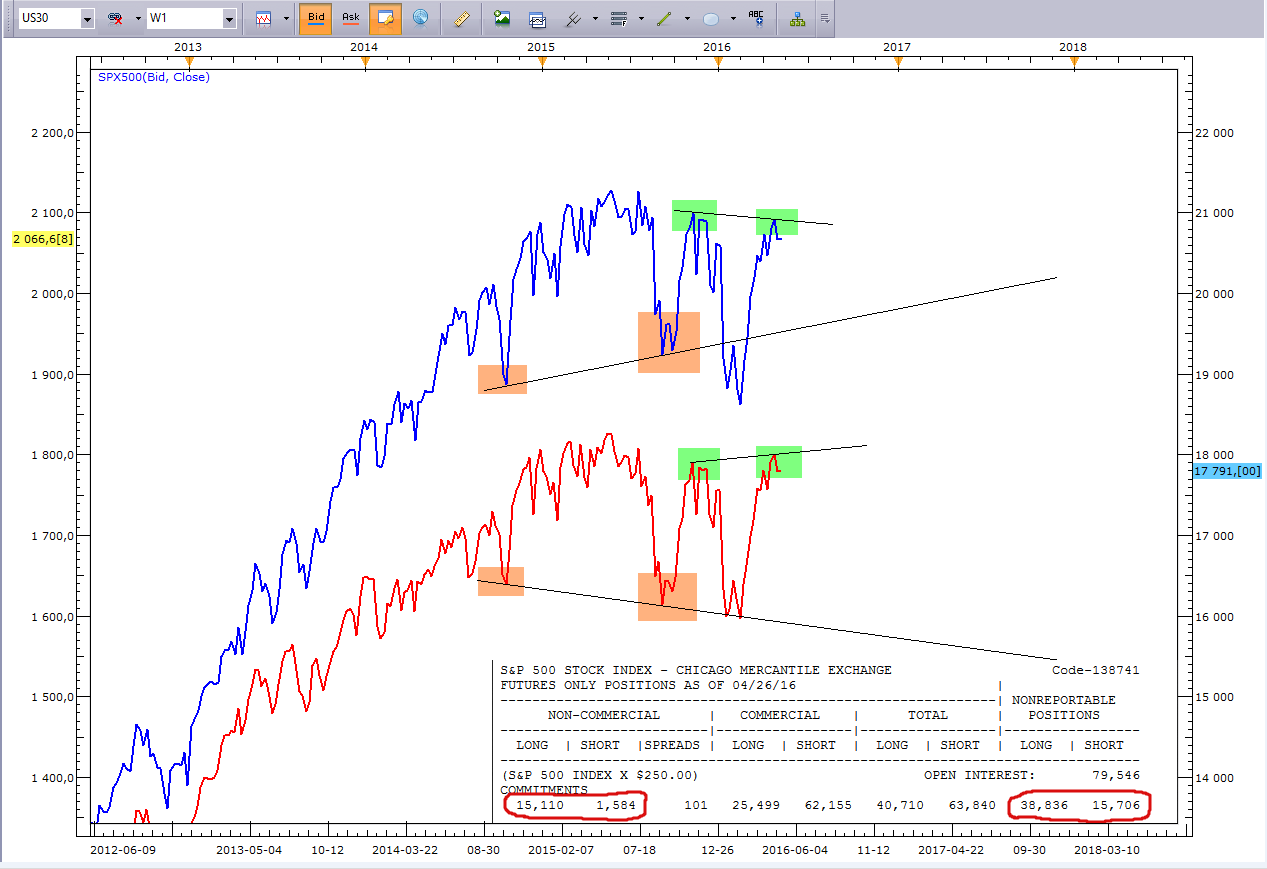
Finally, I have a theory and I am looking to pounce this trade big-time. I have discovered that the DOW (US30) and the S&P (SPX500) are in fact diverging on the weekly chart:
As you can see, the non-commercial traders (speculators) are quite heavily net-long the S&P. At the same time, the non-reportable positions (retail traders) are also quite heavily net-long. It’s a common saying in the markets that the herd are wrong. So there are 2 fundamental notions this trade is based on - (1) the belief that technical analysis has genuine merit to it and (2) that the herd is almost always wrong.
As we open on Monday morning, my expectation is that the non-commercial speculators will start to unwind their long positions, and in the process, retail traders will have their stops taken out. This will ultimately accelerate a move to the downside. The initial downside move will be the result of an expectation of a bad NFP on Friday. I’m putting my money where my mouth is. I’ll post back here when I’m short.
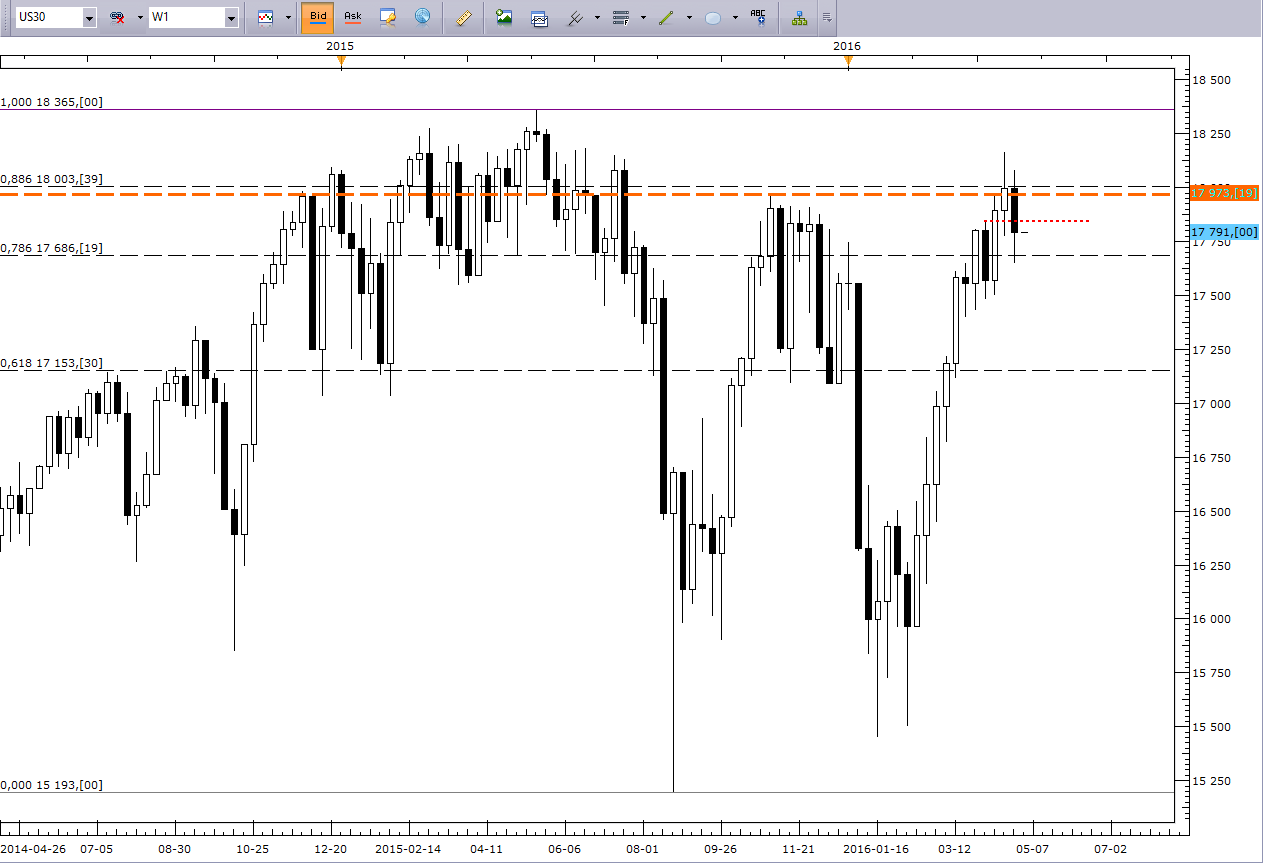
As you can see I bailed on my US30 trade, too. I decided I’m not the kind to take long-term positions (several weeks). Instead, I’ll look to sell continuation patterns such as triple inside bars etc as we hopefully continue to move down.