The Travelers Companies, Inc., TRV, is an American insurance company. It is the second-largest writer of U.S. commercial property casualty insurance, and the sixth-largest writer of U.S. personal insurance through independent agents.
Weekly TRV Chart July 2023
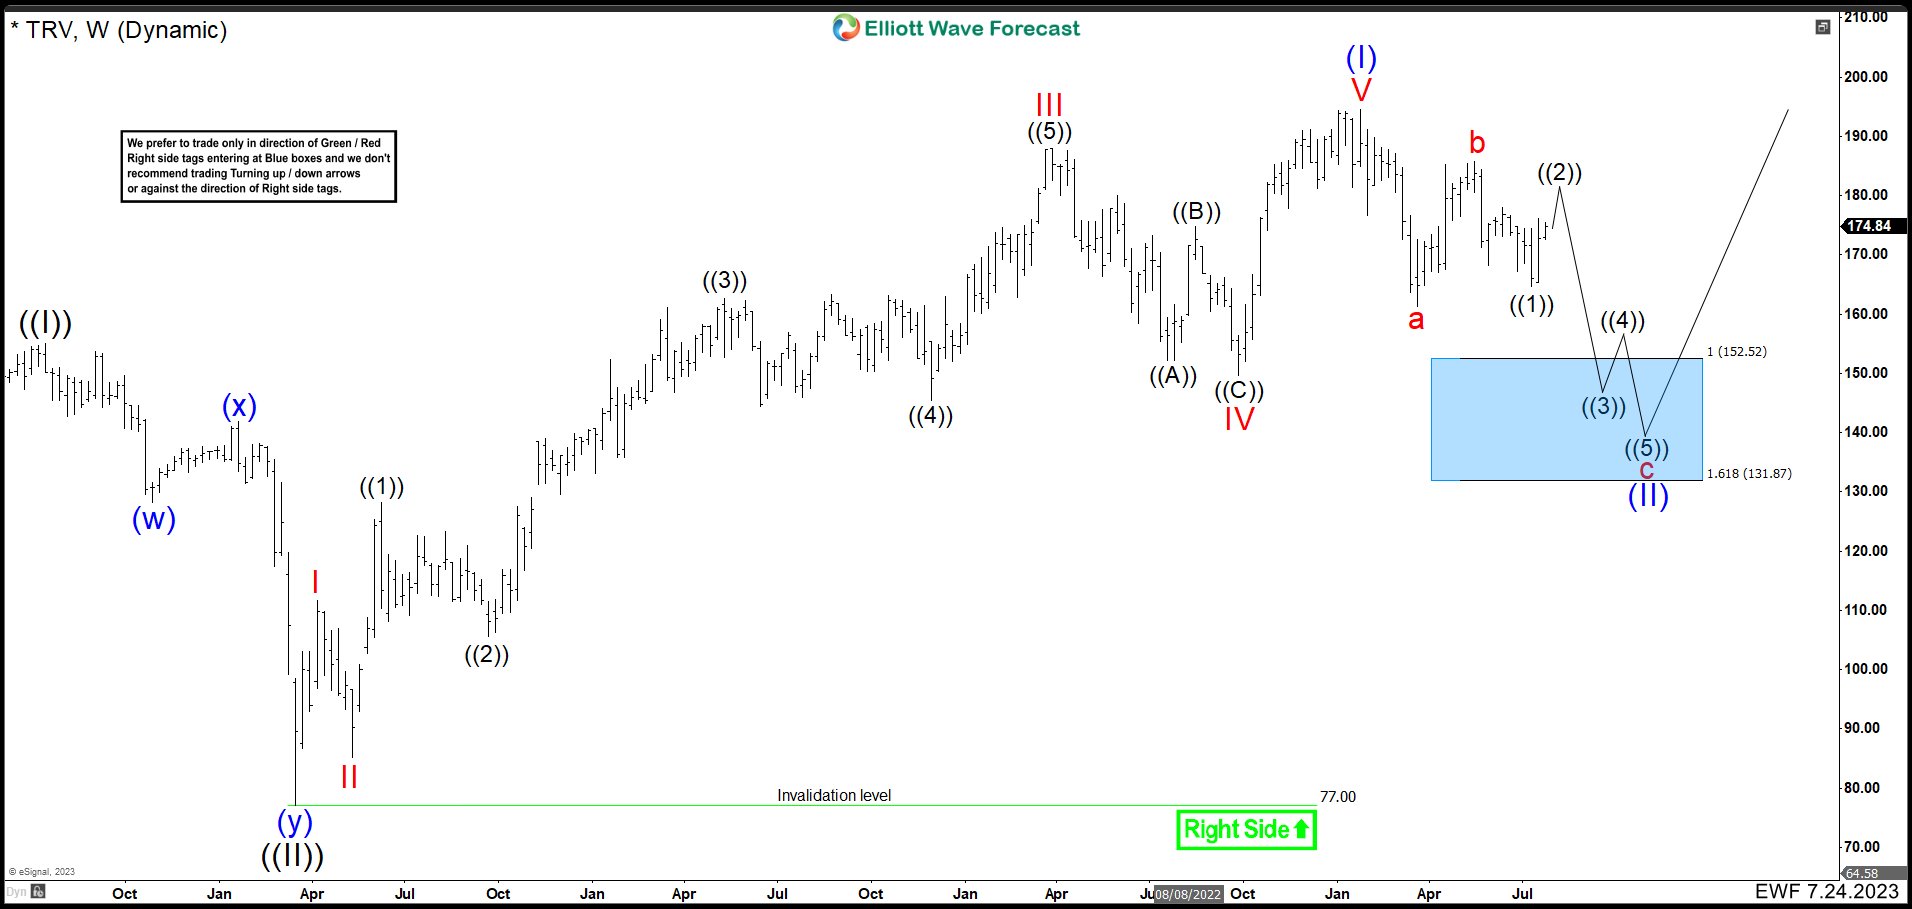
TRV ended a great super cycle in the year of 2019 reaching a peak at $154.86 which we call the wave ((I)). Then the market made a quick and strong correction driven by the COVID19 pandemic in 2020. The company lost 50% of its value reaching $76.99 per share in March. This culminated wave ((II)) and we are currently building wave ((III)). Wave (I) of ((III)) ended at $194.51 in January 2023 building an impulse and it has been correcting in wave (II) of ((III)) ever since.
Weekly TRV Chart November 2023
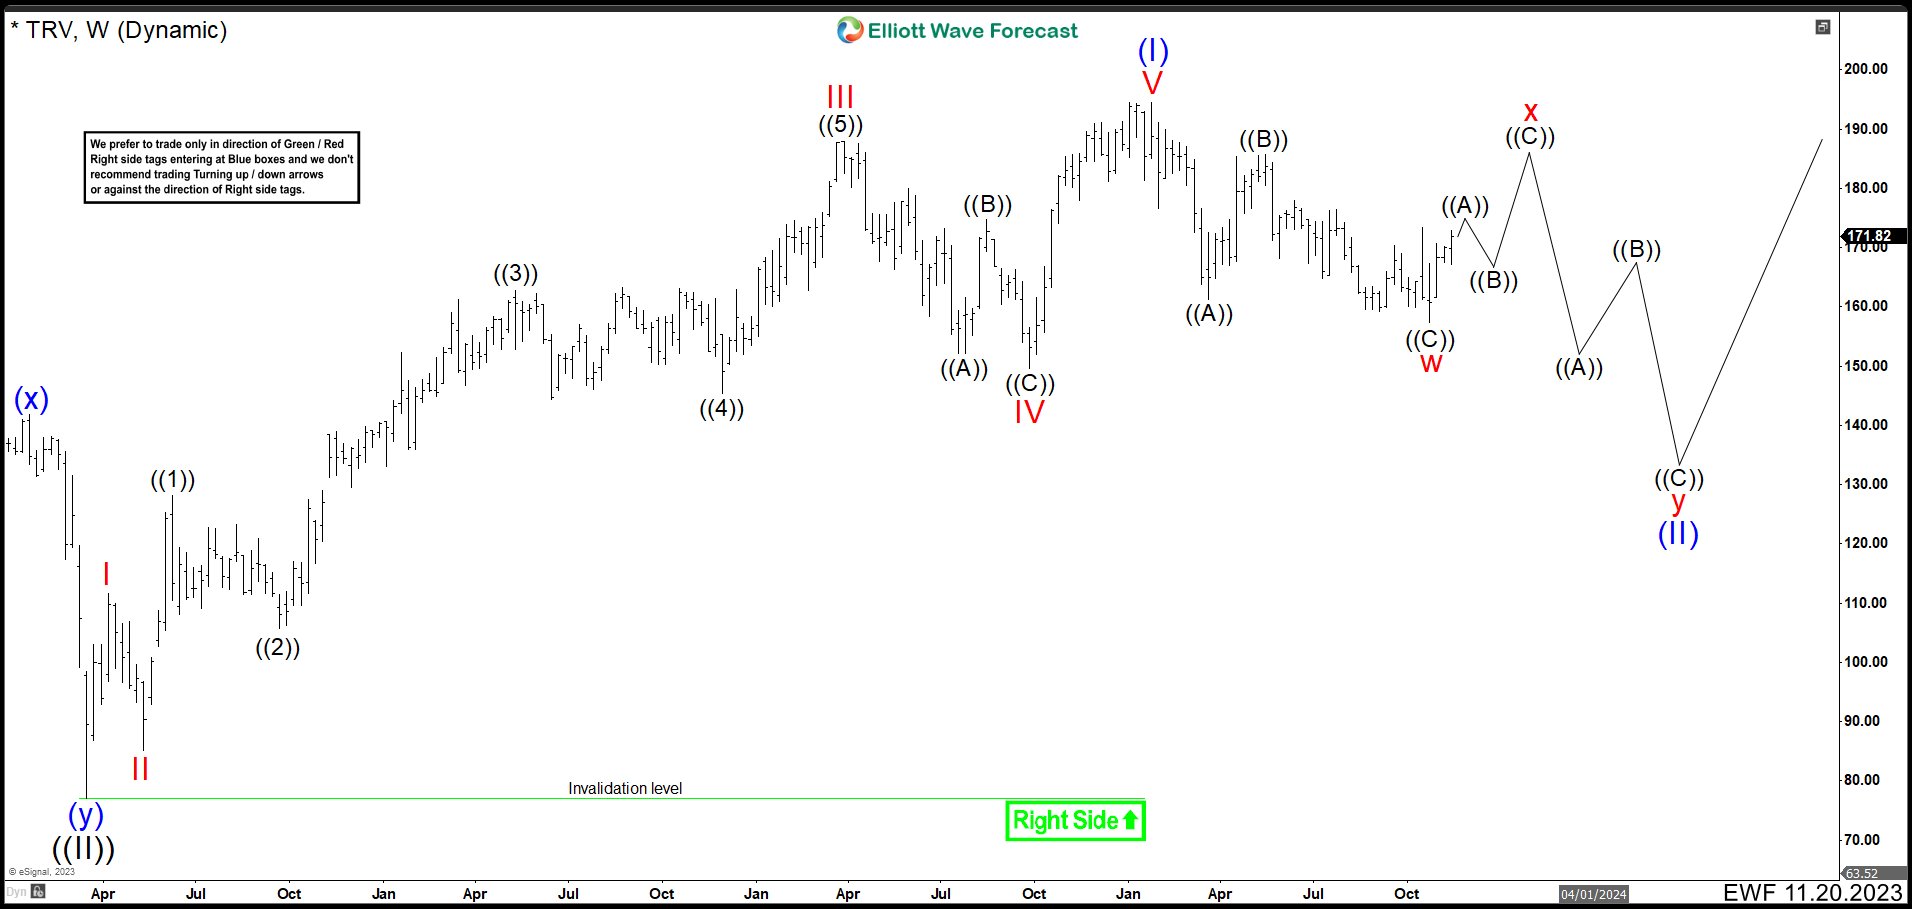
The new chart above shows that TRV continued lower as expected. However, given the market conditions in this month looks like is going to correct the cycle from January 2023 high. Therefore, we can see clearly 3 waves lower from the peak and the stock should make 3 waves higher before resuming to the downside. There are 2 structures to use in this case, a flat correction or a double correction. The flat correction has a structure of 3-3-5 and the double correction is 3-3-3. The only difference is the end of the structure, but either way the stock should turn lower again.
Wave ((A)) of (II) fell to the price of $161.33 in March and the rebound as wave ((B)) ended at $185.77. The last swing lower as wave ((C)) ended in October 23rd at 157.33 and also ended wave “w”. From here, TRV made a strong rally that should continue until wave “x” is completed. As long as the price action is below wave (I) peak, we expect to continue to the downside building 3 waves lower as “y” of (II).