I’m new and I found one of the Symmetrical Triangles on the daily chart is this a for sure thing plz look at it and let me know
Nice find. It would be a good time to buy right now if you believe the triangle is going to hold up.
Nothing is EVER a sure thing in this business… period. But it may be possible to go up and even down. Price hasn’t told you yet… it has only given you a ‘heads up’ that it is consolidating on a larger scale (daily chart). It could take days… even weeks for it to tell you want it is going to do. I personally would only trade this as a breakout trade… once it broke out of the triangle would I then take it… in the direction of the break out and then some price action.
very interesting as its consolidating at a lower trend line presently.
look to a breakout at 2961 and a move to 3037 ---- breaking THAT, watch for 3162 which “should” be tops before reversing.
but dont expect it to happen overnite — Daily charts take time to get to where theyre going, as they make many a rest stop along the way !
enjoy and trade well
mp
[I][B]Within the great hall at Elfinore stands a wondrous coffer, precisely four cubits square and securely latched against the outside world. Inside that repository, shut away from impertinent eyes, abides many an intriquing trading secret garnered from around the world and over the ages !
As a child, i used to watch from the darkness as the secrets were debated and annotated by the elders. No one there held a single thought of my presence – BUT I KNOW WHERE THEY HID THE KEY !![/B][/I]
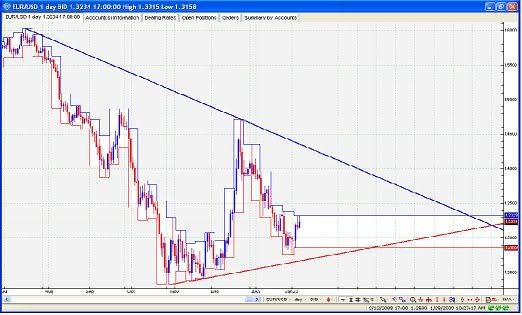
Well it’s at the bottom of the triangle right now, and well a hammer formed on the 12th (Note: the image considers a day to be over at 5pm EST. A “purer” hammer can be found on charts that close at 11pm or 12am EST).

It could also try and test the support on the daily charts at around 1.23…
Well if you are going to long the EUR-Dollar you have some pretty good risk/reward as you’re longing at support. The currency has been consolidating/forming a pennant for the past few weeks which does suggest a possible breakout downwards (and if it does breakout downwards you still can trade it; plus if it breaks out downwards I’d suggest it may head even lower than 1.23).
Still, a hammer at support is very difficult to ignore.
There is a potential EMA crossover on this daily chart, possibly time for a long position? I will wait for today’s candle to close.

Nope still ahead of myself…I used the hourly charts, found a EMA crossover which indicated a short, which I followed throught out the NY session.